


FX.co ★ Actual patterns. Technical analysis and trading recommendations
Actual patterns

Inverse Head and Shoulder
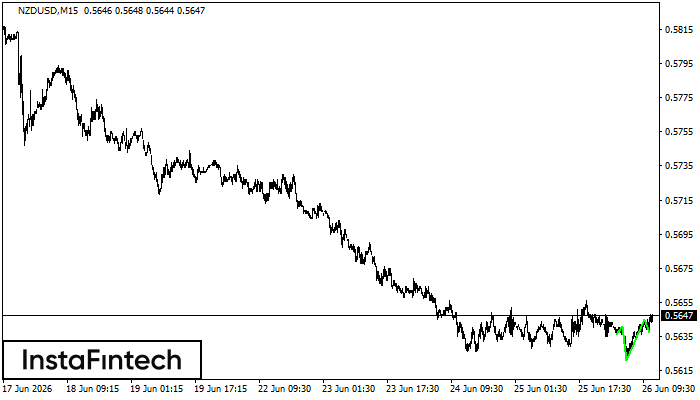
According to M15, NZDUSD is shaping the technical pattern – the Inverse Head and Shoulder. In case the Neckline 0.5641/0.5645 is broken out, the instrument is likely to move toward 0.5667.
Bearish Rectangle
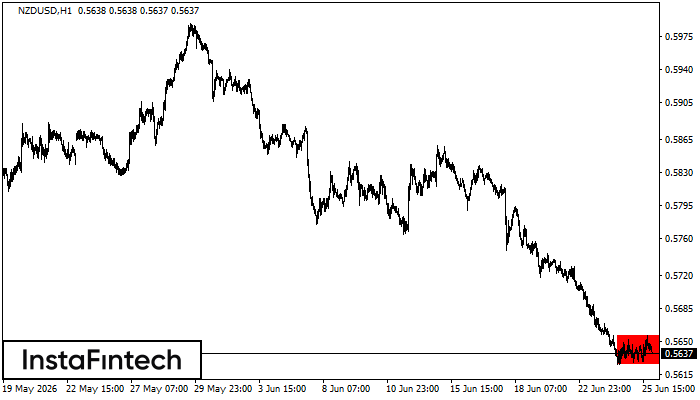
According to the chart of H1, NZDUSD formed the Bearish Rectangle. This type of a pattern indicates a trend continuation. It consists of two levels: resistance 0.5656 - 0.0000 and support 0.5626 – 0.5626. In case the resistance level 0.5626 - 0.5626 is broken, the instrument is likely to follow the bearish trend.
REGISTER
on the forum for traders
AND EARN MONEY!
Register nowon the forum for traders
AND EARN MONEY!
Double Bottom
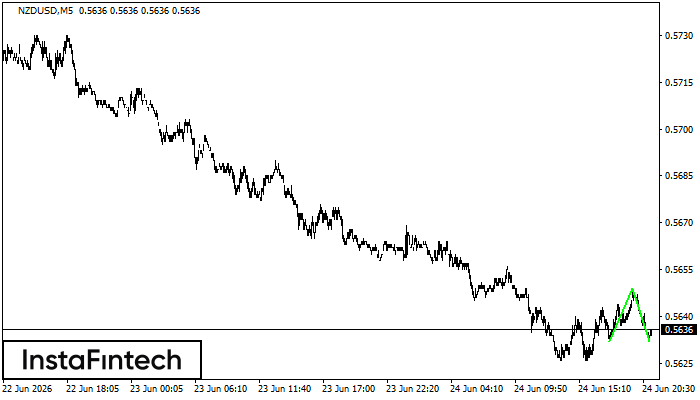
The Double Bottom pattern has been formed on NZDUSD M5; the upper boundary is 0.5649; the lower boundary is 0.5632. The width of the pattern is 17 points. In case of a break of the upper boundary 0.5649, a change in the trend can be predicted where the width of the pattern will coincide with the distance to a possible take profit level.
Inverse Head and Shoulder
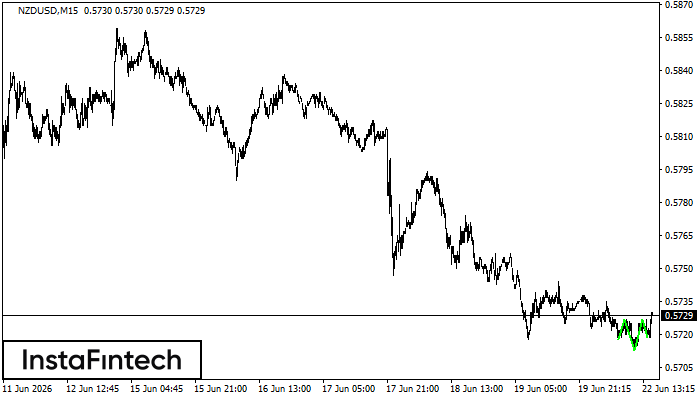
According to M15, NZDUSD is shaping the technical pattern – the Inverse Head and Shoulder. In case the Neckline 0.5727/0.5727 is broken out, the instrument is likely to move toward 0.5749.
Inverse Head and Shoulder
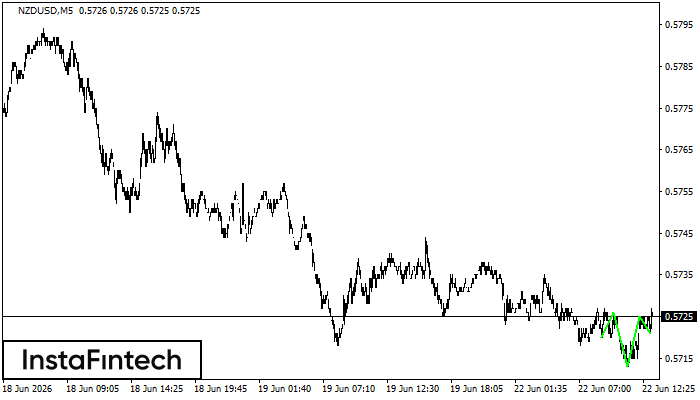
According to M5, NZDUSD is shaping the technical pattern – the Inverse Head and Shoulder. In case the Neckline 0.5726/0.5725 is broken out, the instrument is likely to move toward 0.5740.


