


FX.co ★ Actual patterns. Technical analysis and trading recommendations
Actual patterns

Triple Top
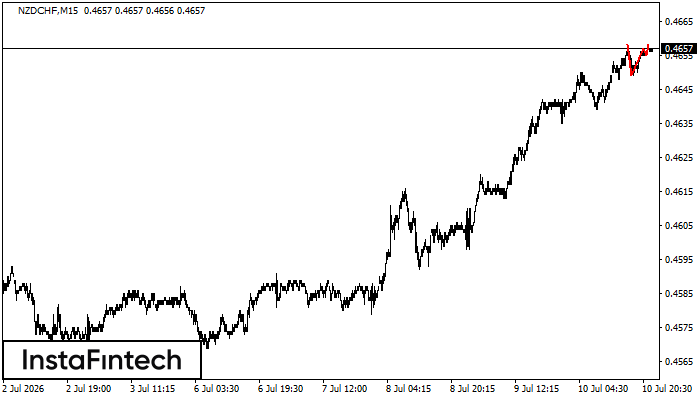
On the chart of the NZDCHF M15 trading instrument, the Triple Top pattern that signals a trend change has formed. It is possible that after formation of the third peak, the price will try to break through the resistance level 0.4649, where we advise to open a trading position for sale. Take profit is the projection of the pattern’s width, which is 9 points.
Double Top
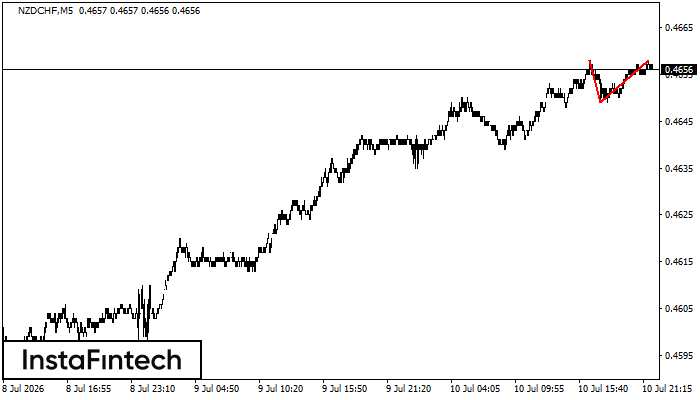
The Double Top pattern has been formed on NZDCHF M5. It signals that the trend has been changed from upwards to downwards. Probably, if the base of the pattern 0.4649 is broken, the downward movement will continue.
Bullish Rectangle
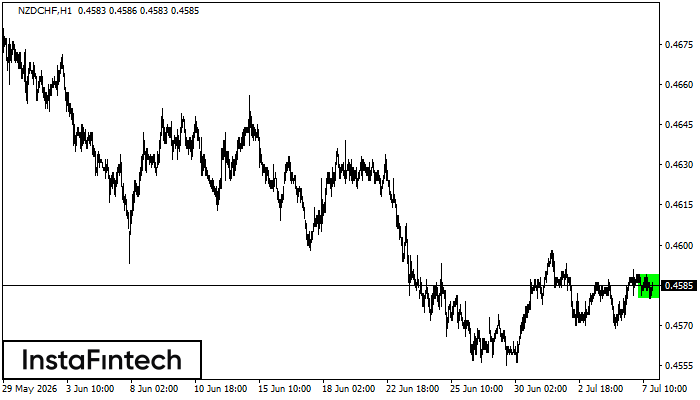
According to the chart of H1, NZDCHF formed the Bullish Rectangle. The pattern indicates a trend continuation. The upper border is 0.4589, the lower border is 0.4580. The signal means that a long position should be opened above the upper border 0.4589 of the Bullish Rectangle.
Bullish Rectangle
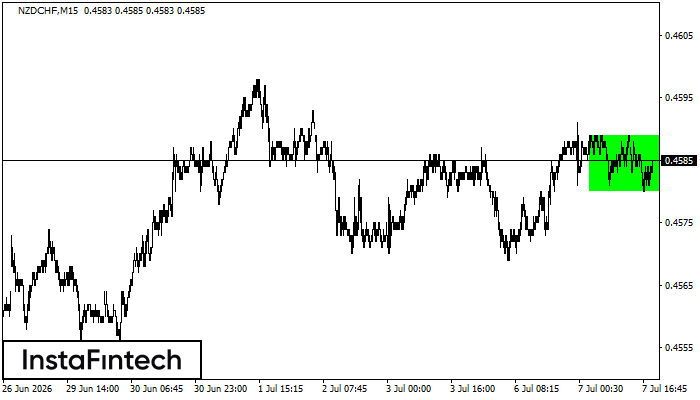
According to the chart of M15, NZDCHF formed the Bullish Rectangle which is a pattern of a trend continuation. The pattern is contained within the following borders: the lower border 0.4580 – 0.4580 and upper border 0.4589 – 0.4589. In case the upper border is broken, the instrument is likely to follow the upward trend.
Bullish Rectangle
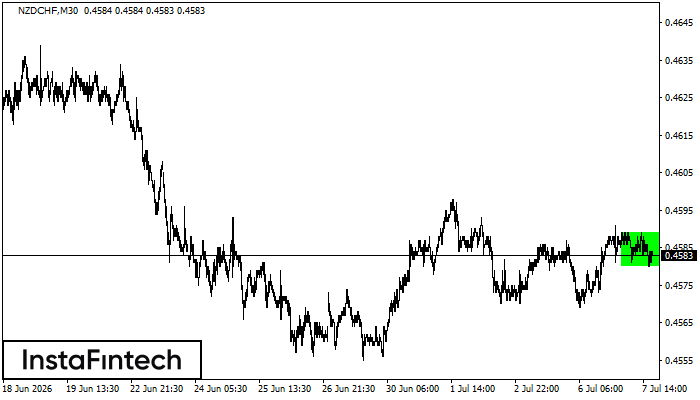
According to the chart of M30, NZDCHF formed the Bullish Rectangle. The pattern indicates a trend continuation. The upper border is 0.4589, the lower border is 0.4580. The signal means that a long position should be opened above the upper border 0.4589 of the Bullish Rectangle.


