


FX.co ★ Actual patterns. Technical analysis and trading recommendations
Actual patterns

Double Bottom
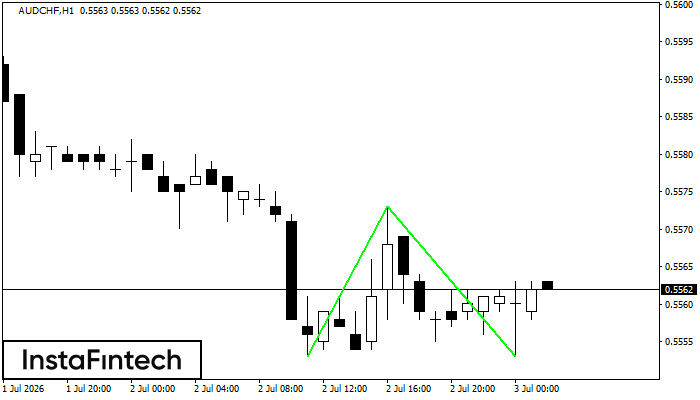
The Double Bottom pattern has been formed on AUDCHF H1. Characteristics: the support level 0.5553; the resistance level 0.5573; the width of the pattern 20 points. If the resistance level is broken, a change in the trend can be predicted with the first target point lying at the distance of 20 points.
Double Top
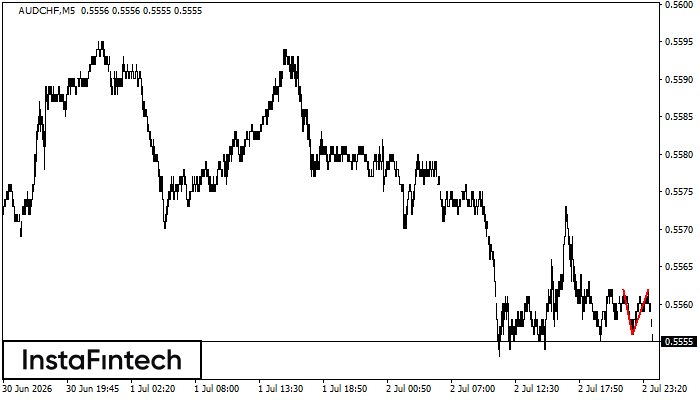
On the chart of AUDCHF M5 the Double Top reversal pattern has been formed. Characteristics: the upper boundary 0.5562; the lower boundary 0.5556; the width of the pattern 6 points. The signal: a break of the lower boundary will cause continuation of the downward trend targeting the 0.5541 level.
Bearish pennant
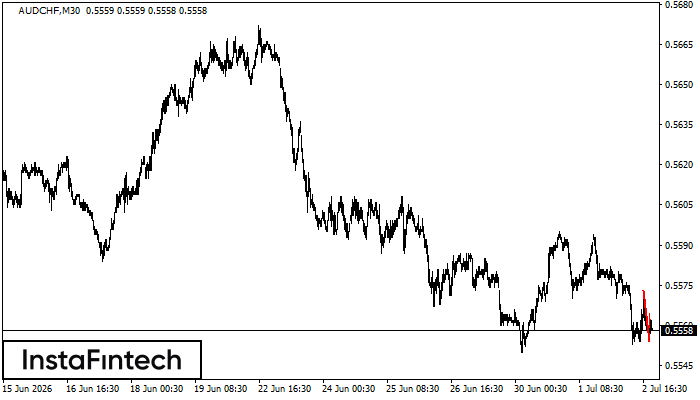
The Bearish pennant pattern has formed on the AUDCHF M30 chart. This pattern type is characterized by a slight slowdown after which the price will move in the direction of the original trend. In case the price fixes below the pattern’s low of 0.5554, a trader will be able to successfully enter the sell position.
Bearish Rectangle
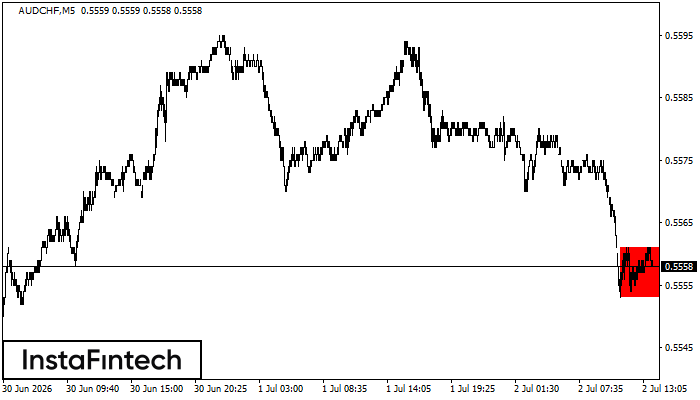
According to the chart of M5, AUDCHF formed the Bearish Rectangle. This type of a pattern indicates a trend continuation. It consists of two levels: resistance 0.5561 - 0.0000 and support 0.5553 – 0.5553. In case the resistance level 0.5553 - 0.5553 is broken, the instrument is likely to follow the bearish trend.
Bullish Rectangle
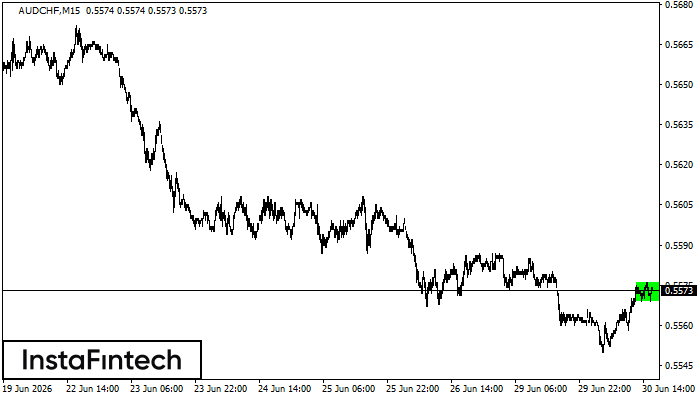
According to the chart of M15, AUDCHF formed the Bullish Rectangle. The pattern indicates a trend continuation. The upper border is 0.5576, the lower border is 0.5569. The signal means that a long position should be opened above the upper border 0.5576 of the Bullish Rectangle.


