


FX.co ★ Actual patterns. Technical analysis and trading recommendations
Actual patterns

Double Top
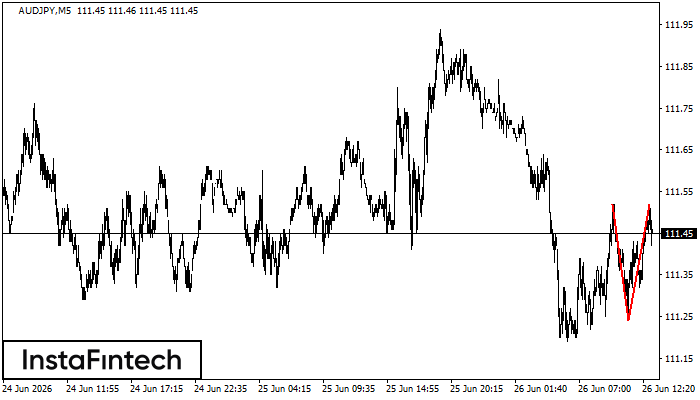
The Double Top reversal pattern has been formed on AUDJPY M5. Characteristics: the upper boundary 111.52; the lower boundary 111.24; the width of the pattern is 28 points. Sell trades are better to be opened below the lower boundary 111.24 with a possible movements towards the 111.09 level.
Bearish Symmetrical Triangle
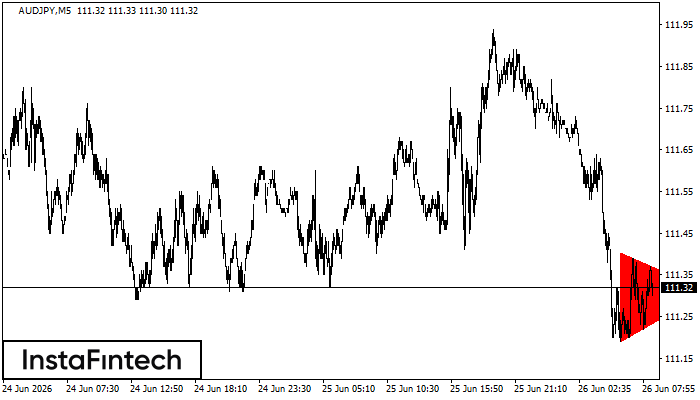
According to the chart of M5, AUDJPY formed the Bearish Symmetrical Triangle pattern. This pattern signals a further downward trend in case the lower border 111.19 is breached. Here, a hypothetical profit will equal the width of the available pattern that is -21 pips.
Double Bottom
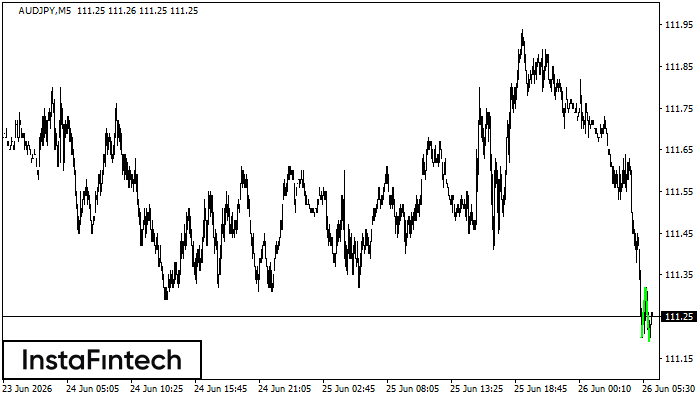
The Double Bottom pattern has been formed on AUDJPY M5. This formation signals a reversal of the trend from downwards to upwards. The signal is that a buy trade should be opened after the upper boundary of the pattern 111.32 is broken. The further movements will rely on the width of the current pattern 12 points.
Double Bottom
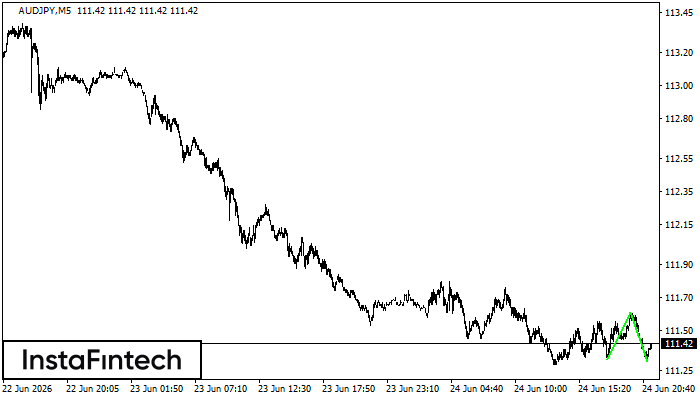
The Double Bottom pattern has been formed on AUDJPY M5. This formation signals a reversal of the trend from downwards to upwards. The signal is that a buy trade should be opened after the upper boundary of the pattern 111.61 is broken. The further movements will rely on the width of the current pattern 29 points.
Double Top
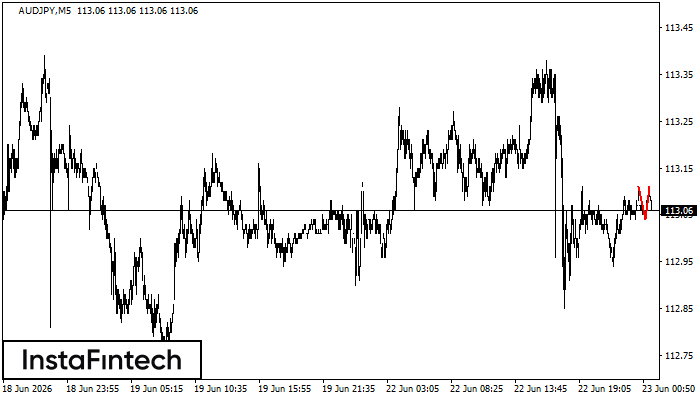
On the chart of AUDJPY M5 the Double Top reversal pattern has been formed. Characteristics: the upper boundary 113.11; the lower boundary 113.04; the width of the pattern 7 points. The signal: a break of the lower boundary will cause continuation of the downward trend targeting the 112.89 level.


