


FX.co ★ Actual patterns. Technical analysis and trading recommendations
Actual patterns

Bearish Rectangle
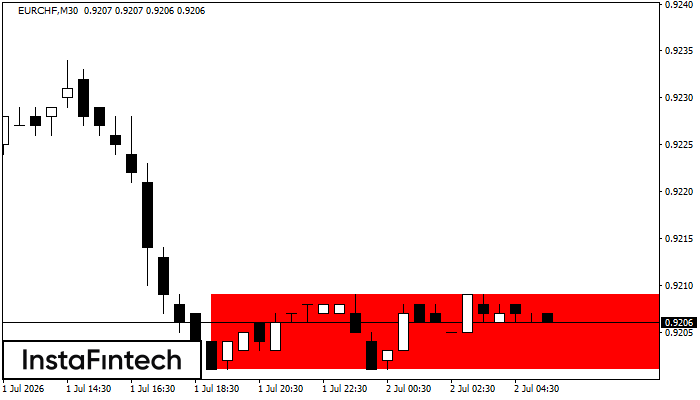
According to the chart of M30, EURCHF formed the Bearish Rectangle. The pattern indicates a trend continuation. The upper border is 0.9209, the lower border is 0.9201. The signal means that a short position should be opened after fixing a price below the lower border 0.9201 of the Bearish Rectangle.
Bearish Rectangle
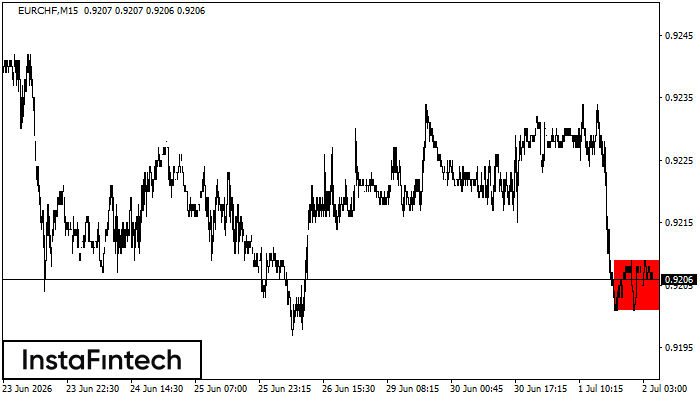
According to the chart of M15, EURCHF formed the Bearish Rectangle. This type of a pattern indicates a trend continuation. It consists of two levels: resistance 0.9209 - 0.0000 and support 0.9201 – 0.9201. In case the resistance level 0.9201 - 0.9201 is broken, the instrument is likely to follow the bearish trend.
Bearish Symmetrical Triangle
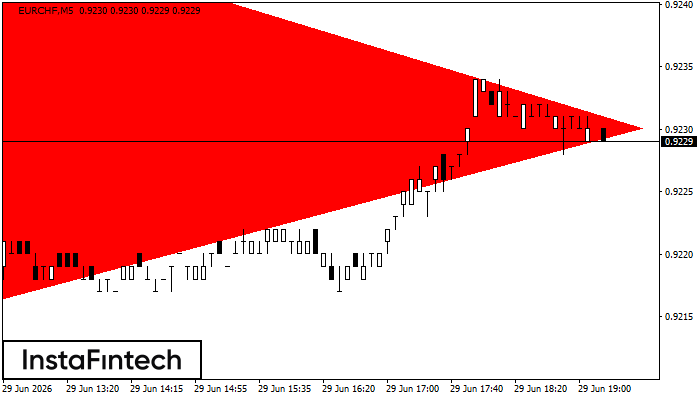
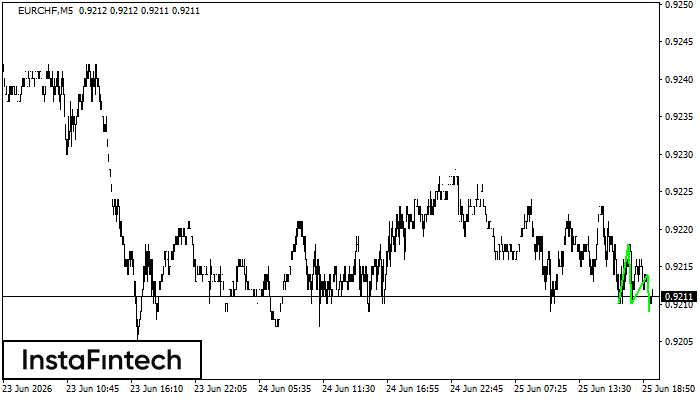
According to the chart of M5, EURCHF formed the Bearish Symmetrical Triangle pattern. Trading recommendations: A breach of the lower border 0.9216 is likely to encourage a continuation of the downward trend.
Triple Bottom
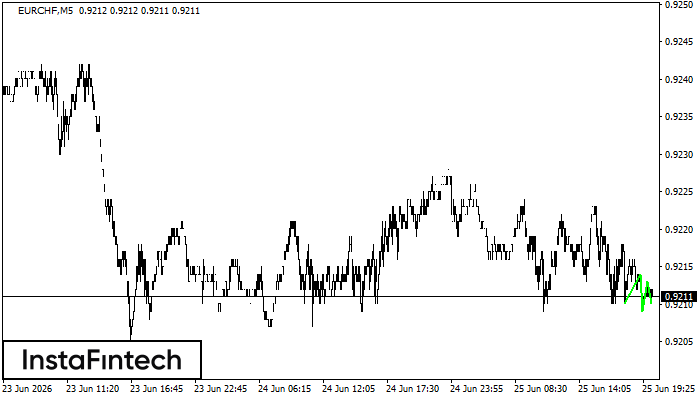
The Triple Bottom pattern has been formed on EURCHF M5. It has the following characteristics: resistance level 0.9214/0.9213; support level 0.9210/0.9210; the width is 4 points. In the event of a breakdown of the resistance level of 0.9214, the price is likely to continue an upward movement at least to 0.9224.
Triple Bottom
The Triple Bottom pattern has formed on the chart of EURCHF M5. Features of the pattern: The lower line of the pattern has coordinates 0.9218 with the upper limit 0.9218/0.9214, the projection of the width is 8 points. The formation of the Triple Bottom pattern most likely indicates a change in the trend from downward to upward. This means that in the event of a breakdown of the resistance level 0.9210, the price is most likely to continue the upward movement.


