


FX.co ★ Actual patterns. Technical analysis and trading recommendations
Actual patterns

Inverse Head and Shoulder
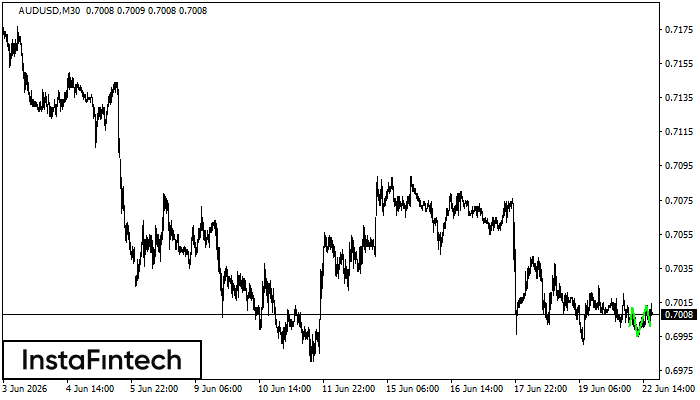
According to M30, AUDUSD is shaping the technical pattern – the Inverse Head and Shoulder. In case the Neckline 0.7012/0.7013 is broken out, the instrument is likely to move toward 0.7043.
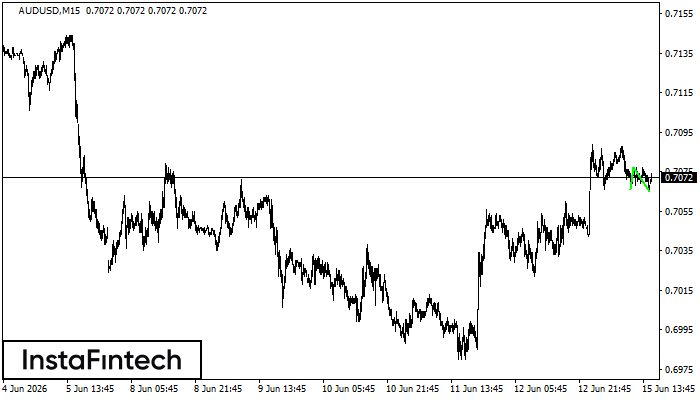
Bullish Rectangle
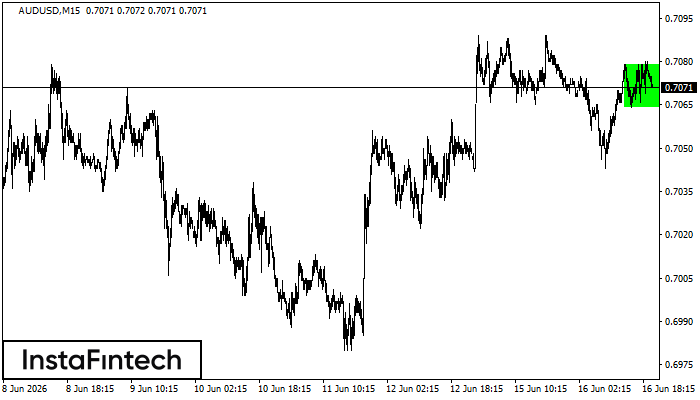
According to the chart of M15, AUDUSD formed the Bullish Rectangle. The pattern indicates a trend continuation. The upper border is 0.7079, the lower border is 0.7064. The signal means that a long position should be opened above the upper border 0.7079 of the Bullish Rectangle.
REGISTER
on the forum for traders
AND EARN MONEY!
Register nowon the forum for traders
AND EARN MONEY!
Double Top
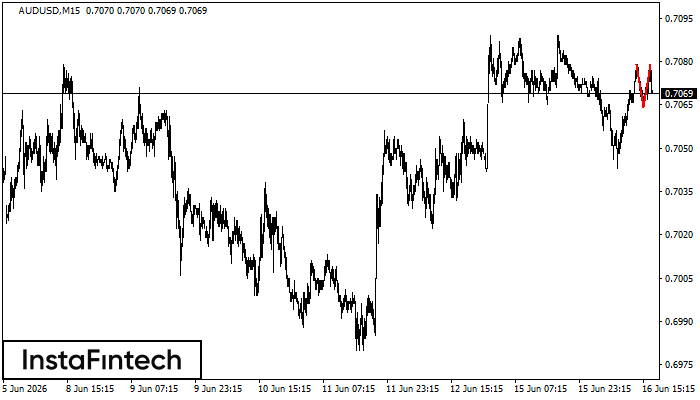
The Double Top pattern has been formed on AUDUSD M15. It signals that the trend has been changed from upwards to downwards. Probably, if the base of the pattern 0.7064 is broken, the downward movement will continue.
Triple Bottom
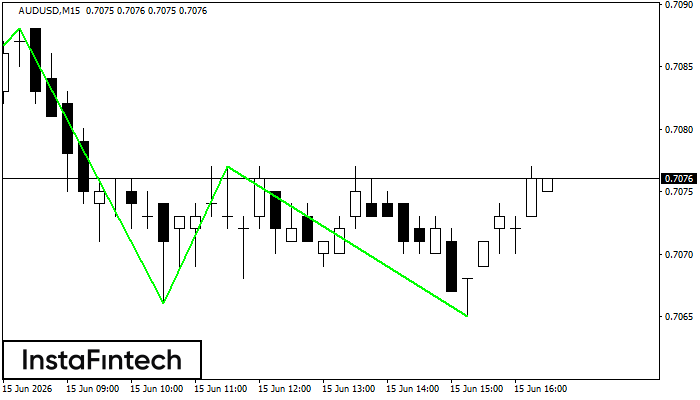
The Triple Bottom pattern has formed on the chart of the AUDUSD M15 trading instrument. The pattern signals a change in the trend from downwards to upwards in the case of breakdown of 0.7088/0.7077.
Double Bottom
The Double Bottom pattern has been formed on AUDUSD M15. This formation signals a reversal of the trend from downwards to upwards. The signal is that a buy trade should be opened after the upper boundary of the pattern 0.7077 is broken. The further movements will rely on the width of the current pattern 11 points.


