


FX.co ★ Actual patterns. Technical analysis and trading recommendations
Actual patterns

Double Top
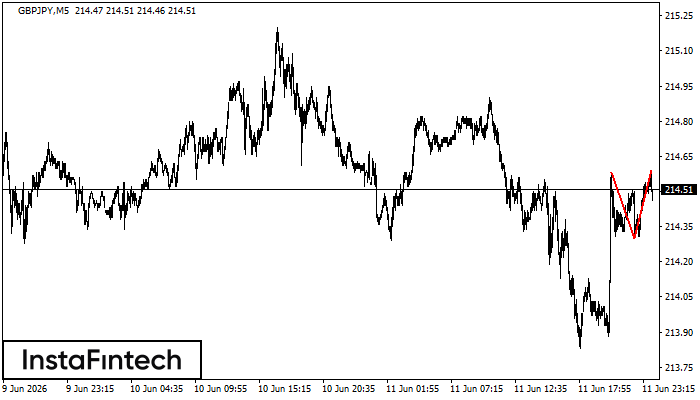
On the chart of GBPJPY M5 the Double Top reversal pattern has been formed. Characteristics: the upper boundary 214.59; the lower boundary 214.30; the width of the pattern 29 points. The signal: a break of the lower boundary will cause continuation of the downward trend targeting the 214.15 level.
Bearish pennant
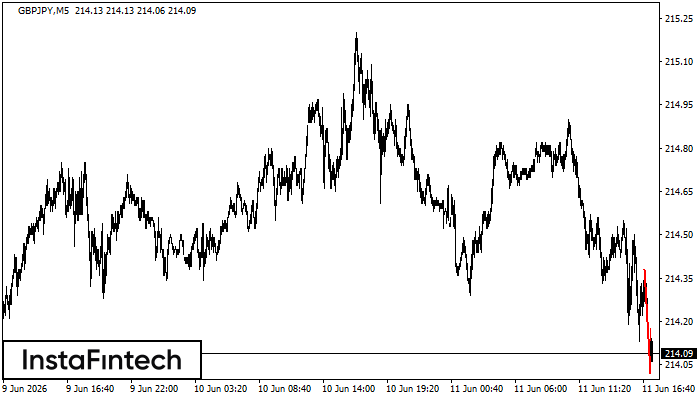
The Bearish pennant pattern has formed on the GBPJPY M5 chart. It signals potential continuation of the existing trend. Specifications: the pattern’s bottom has the coordinate of 214.02; the projection of the flagpole height is equal to 36 pips. In case the price breaks out the pattern’s bottom of 214.02, the downtrend is expected to continue for further level 213.87.
REGISTER
on the forum for traders
AND EARN MONEY!
Register nowon the forum for traders
AND EARN MONEY!
Double Bottom
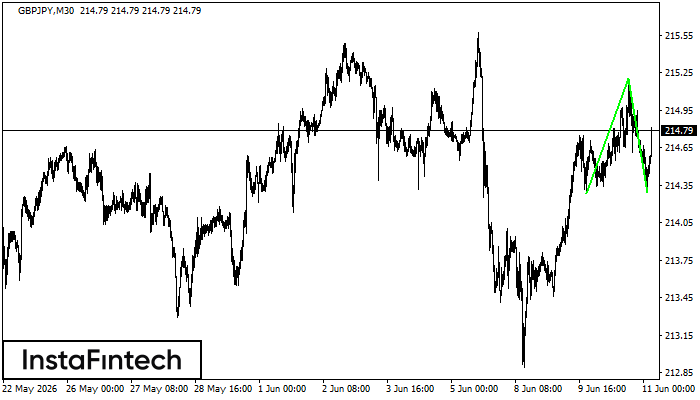
The Double Bottom pattern has been formed on GBPJPY M30. Characteristics: the support level 214.28; the resistance level 215.20; the width of the pattern 92 points. If the resistance level is broken, a change in the trend can be predicted with the first target point lying at the distance of 91 points.
Bearish Symmetrical Triangle
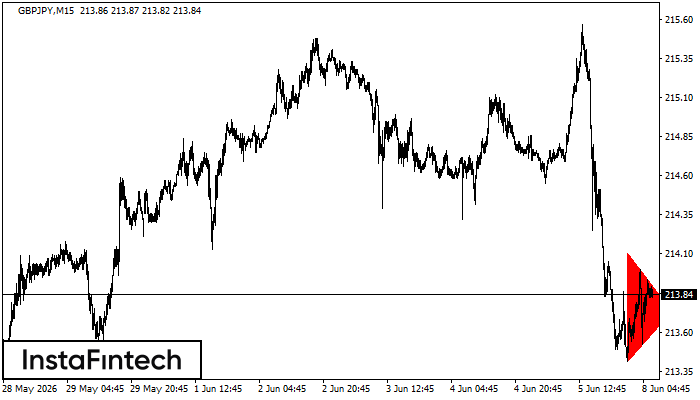
According to the chart of M15, GBPJPY formed the Bearish Symmetrical Triangle pattern. Trading recommendations: A breach of the lower border 213.41 is likely to encourage a continuation of the downward trend.
Bullish Symmetrical Triangle
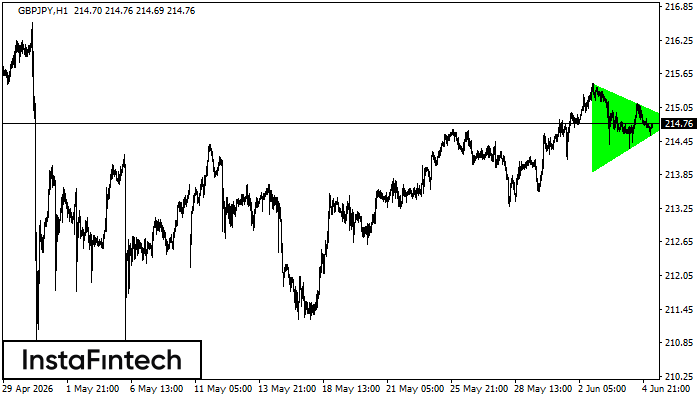
According to the chart of H1, GBPJPY formed the Bullish Symmetrical Triangle pattern, which signals the trend will continue. Description. The upper border of the pattern touches the coordinates 215.48/214.82 whereas the lower border goes across 213.91/214.82. The pattern width is measured on the chart at 157 pips. If the Bullish Symmetrical Triangle pattern is in progress during the upward trend, this indicates the current trend will go on. In case 214.82 is broken, the price could continue its move toward 215.22.


