


FX.co ★ Actual patterns. Technical analysis and trading recommendations
Actual patterns

Double Bottom
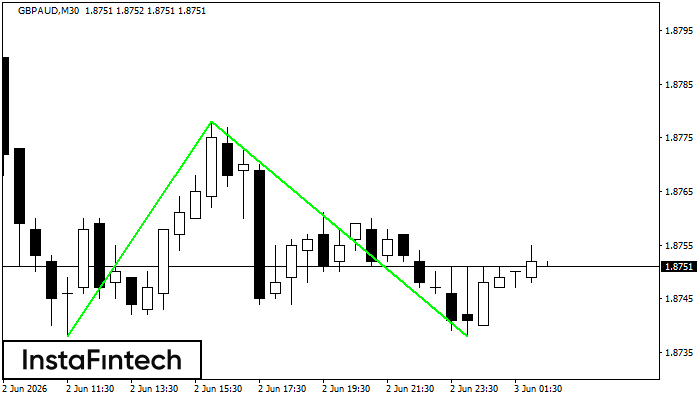
The Double Bottom pattern has been formed on GBPAUD M30; the upper boundary is 1.8778; the lower boundary is 1.8738. The width of the pattern is 40 points. In case of a break of the upper boundary 1.8778, a change in the trend can be predicted where the width of the pattern will coincide with the distance to a possible take profit level.
Double Bottom
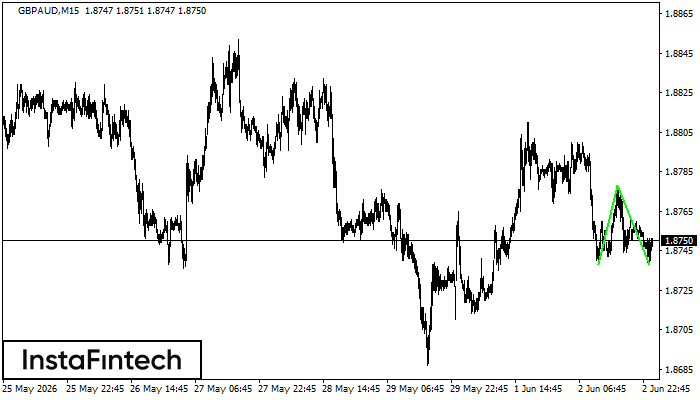
The Double Bottom pattern has been formed on GBPAUD M15; the upper boundary is 1.8778; the lower boundary is 1.8738. The width of the pattern is 40 points. In case of a break of the upper boundary 1.8778, a change in the trend can be predicted where the width of the pattern will coincide with the distance to a possible take profit level.
REGISTER
on the forum for traders
AND EARN MONEY!
Register nowon the forum for traders
AND EARN MONEY!
Bearish Symmetrical Triangle
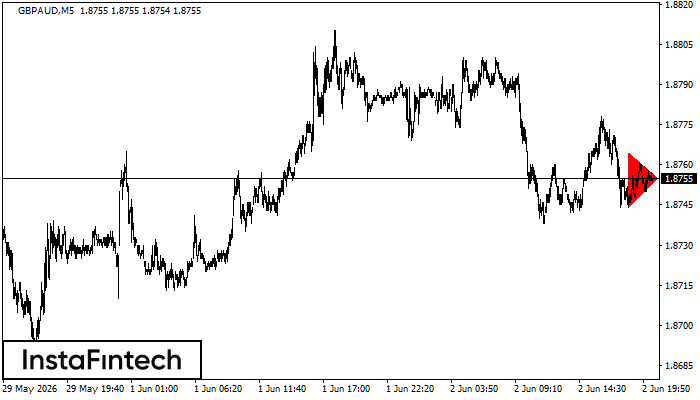
According to the chart of M5, GBPAUD formed the Bearish Symmetrical Triangle pattern. Trading recommendations: A breach of the lower border 1.8744 is likely to encourage a continuation of the downward trend.
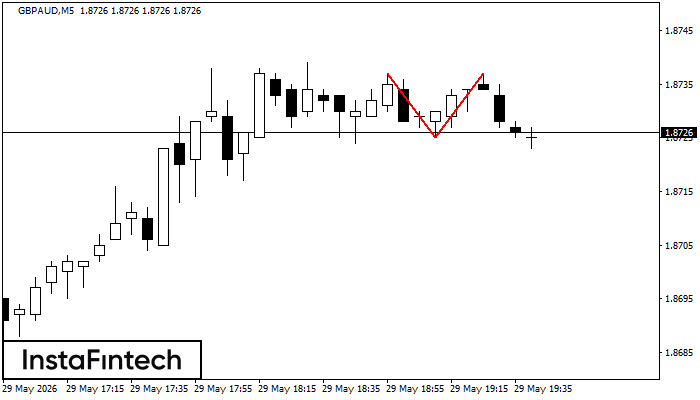
Double Bottom
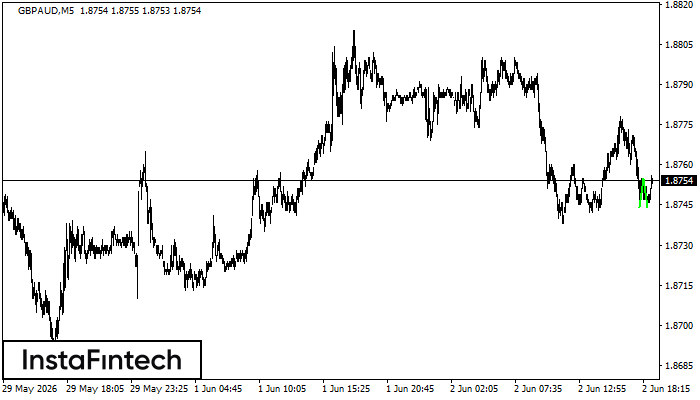
The Double Bottom pattern has been formed on GBPAUD M5. Characteristics: the support level 1.8744; the resistance level 1.8755; the width of the pattern 11 points. If the resistance level is broken, a change in the trend can be predicted with the first target point lying at the distance of 11 points.
Double Top
The Double Top pattern has been formed on GBPAUD M5. It signals that the trend has been changed from upwards to downwards. Probably, if the base of the pattern 1.8725 is broken, the downward movement will continue.


