


FX.co ★ Actual patterns. Technical analysis and trading recommendations
Actual patterns

Bearish Rectangle
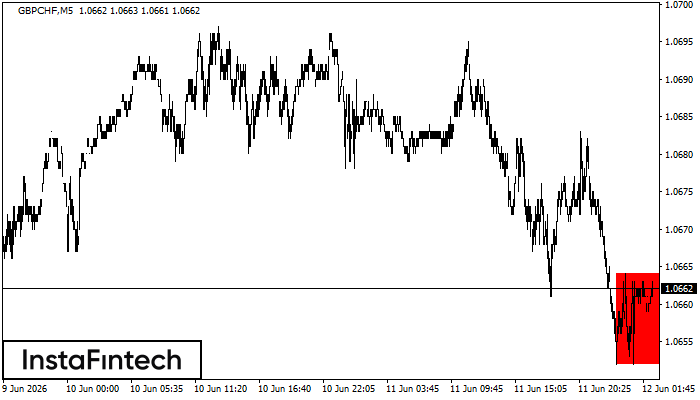
According to the chart of M5, GBPCHF formed the Bearish Rectangle which is a pattern of a trend continuation. The pattern is contained within the following borders: lower border 1.0652 – 1.0652 and upper border 1.0664 – 1.0664. In case the lower border is broken, the instrument is likely to follow the downward trend.
Double Top
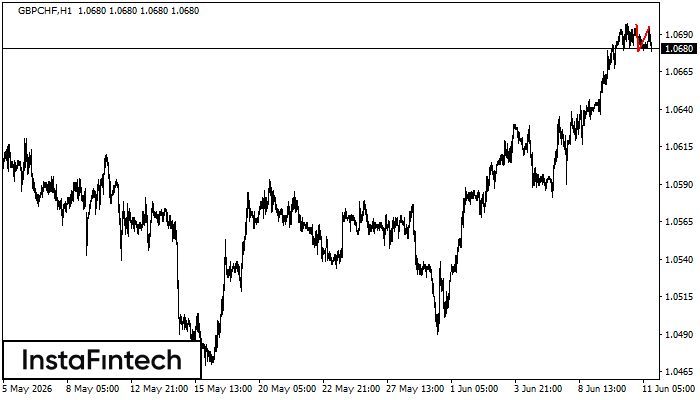
On the chart of GBPCHF H1 the Double Top reversal pattern has been formed. Characteristics: the upper boundary 1.0695; the lower boundary 1.0678; the width of the pattern 17 points. The signal: a break of the lower boundary will cause continuation of the downward trend targeting the 1.0638 level.
Head and Shoulders
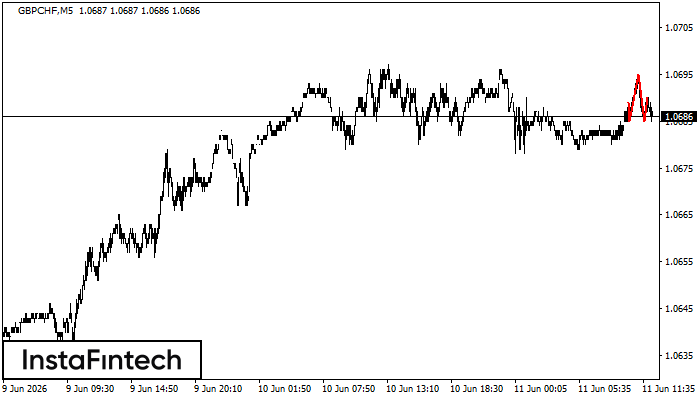
The GBPCHF M5 formed the Head and Shoulders pattern with the following features: The Head’s top is at 1.0695, the Neckline and the upward angle are at 1.0685/1.0685. The formation of this pattern can bring about changes in the current trend from bullish to bearish. In case the pattern triggers the expected changes, the price of GBPCHF will go towards 1.0670.
Triple Bottom
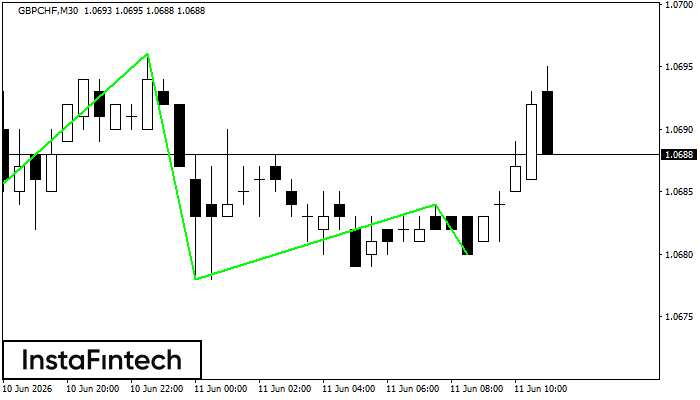
The Triple Bottom pattern has formed on the chart of GBPCHF M30. Features of the pattern: The lower line of the pattern has coordinates 1.0696 with the upper limit 1.0696/1.0684, the projection of the width is 16 points. The formation of the Triple Bottom pattern most likely indicates a change in the trend from downward to upward. This means that in the event of a breakdown of the resistance level 1.0680, the price is most likely to continue the upward movement.
Triple Bottom
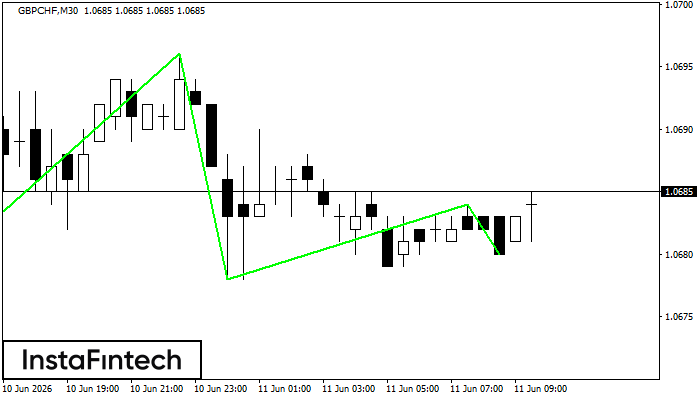
The Triple Bottom pattern has formed on the chart of GBPCHF M30. Features of the pattern: The lower line of the pattern has coordinates 1.0696 with the upper limit 1.0696/1.0684, the projection of the width is 16 points. The formation of the Triple Bottom pattern most likely indicates a change in the trend from downward to upward. This means that in the event of a breakdown of the resistance level 1.0680, the price is most likely to continue the upward movement.


