


FX.co ★ Actual patterns. Technical analysis and trading recommendations
Actual patterns

Head and Shoulders
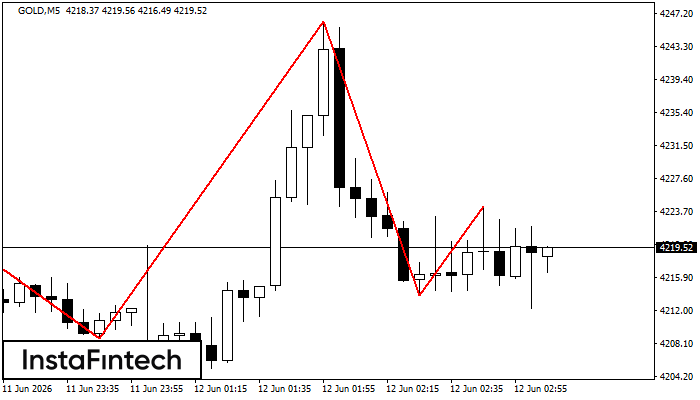
The technical pattern called Head and Shoulders has appeared on the chart of GOLD M5. There are weighty reasons to suggest that the price will surpass the Neckline 4208.68/4213.84 after the right shoulder has been formed. So, the trend is set to change with the price heading for 4213.69.
Bearish Symmetrical Triangle
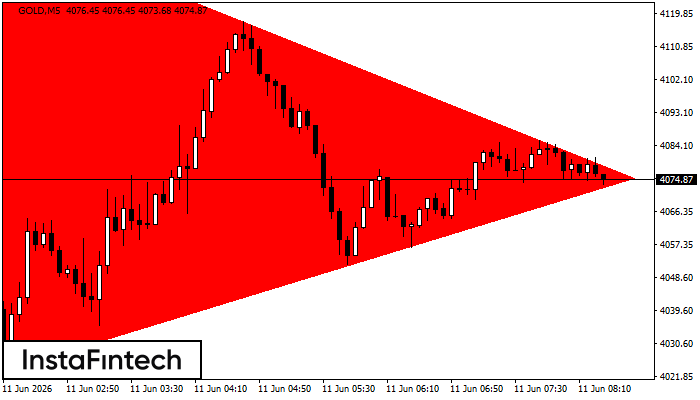
According to the chart of M5, GOLD formed the Bearish Symmetrical Triangle pattern. Description: The lower border is 4023.48/4075.39 and upper border is 4143.72/4075.39. The pattern width is measured on the chart at -12024 pips. The formation of the Bearish Symmetrical Triangle pattern evidently signals a continuation of the downward trend. In other words, if the scenario comes true and GOLD breaches the lower border, the price could continue its move toward 4075.24.
Inverse Head and Shoulder
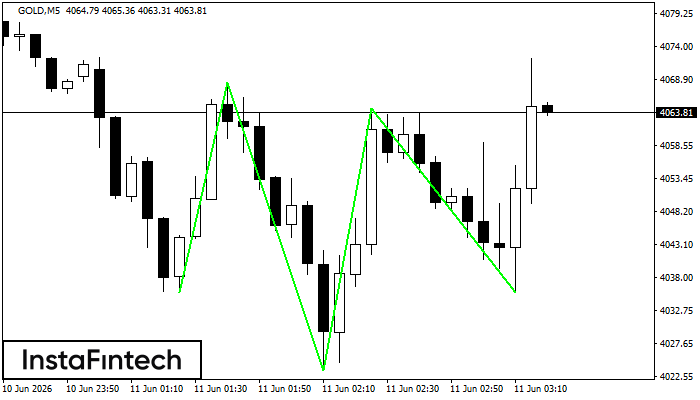
According to M5, GOLD is shaping the technical pattern – the Inverse Head and Shoulder. In case the Neckline 4068.47/4064.37 is broken out, the instrument is likely to move toward 4064.52.
Bullish Symmetrical Triangle
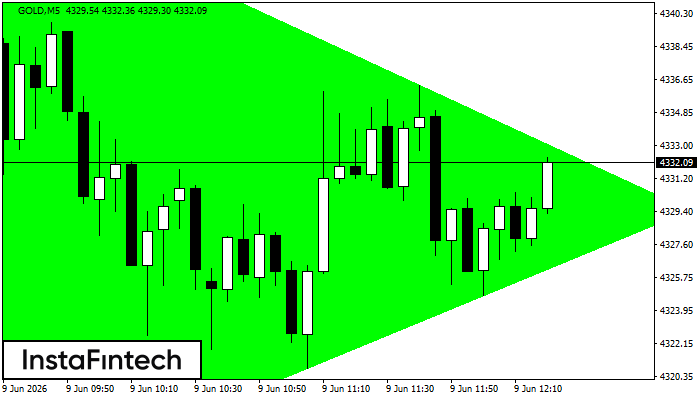
According to the chart of M5, GOLD formed the Bullish Symmetrical Triangle pattern. The lower border of the pattern touches the coordinates 4310.25/4329.45 whereas the upper border goes across 4350.97/4329.45. If the Bullish Symmetrical Triangle pattern is in progress, this evidently signals a further upward trend. In other words, in case the scenario comes true, the price of GOLD will breach the upper border to head for 4329.60.
Bearish Flag
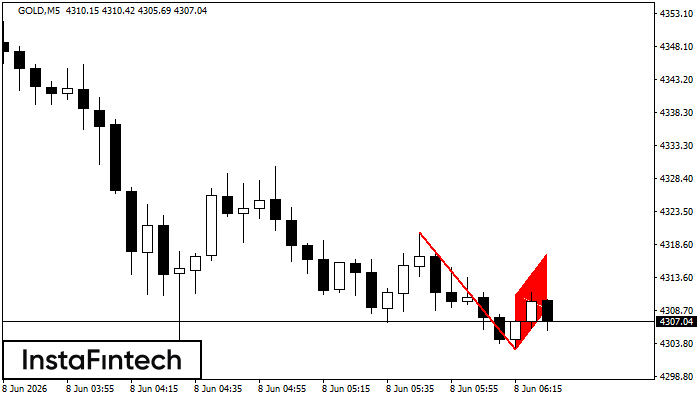
The Bearish Flag pattern has been formed on the chart GOLD M5. Therefore, the downwards trend is likely to continue in the nearest term. As soon as the price breaks below the low at 4302.92, traders should enter the market.


