


FX.co ★ Actual patterns. Technical analysis and trading recommendations
Actual patterns

Bearish Rectangle
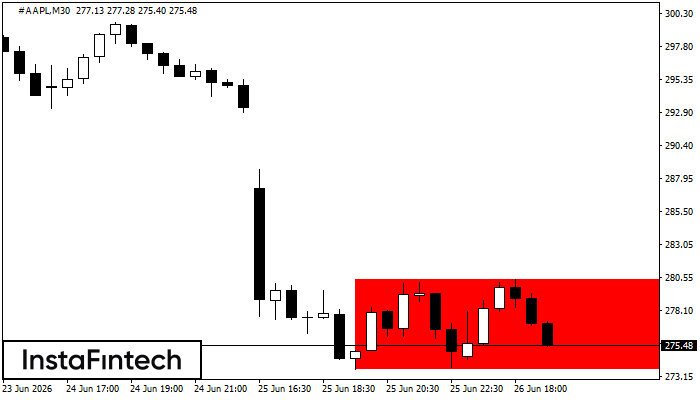
According to the chart of M30, #AAPL formed the Bearish Rectangle. The pattern indicates a trend continuation. The upper border is 280.43, the lower border is 273.74. The signal means that a short position should be opened after fixing a price below the lower border 273.74 of the Bearish Rectangle.
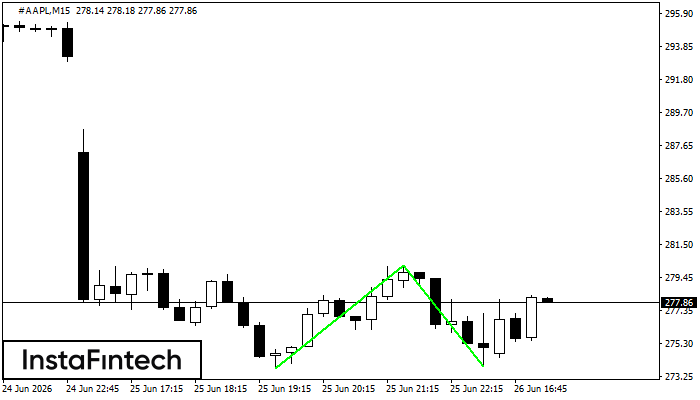
Bearish Rectangle
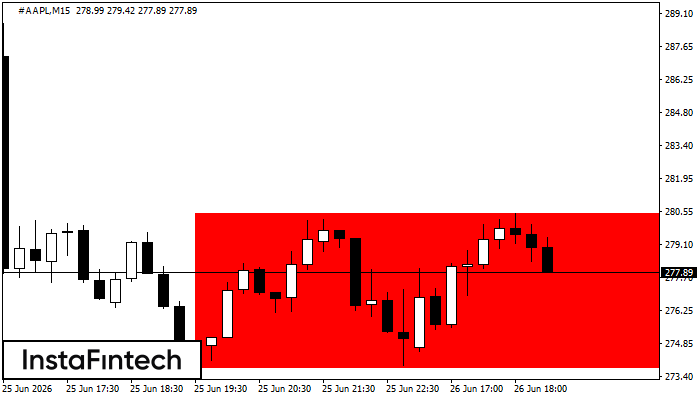
According to the chart of M15, #AAPL formed the Bearish Rectangle which is a pattern of a trend continuation. The pattern is contained within the following borders: lower border 273.74 – 273.74 and upper border 280.43 – 280.43. In case the lower border is broken, the instrument is likely to follow the downward trend.
Double Bottom
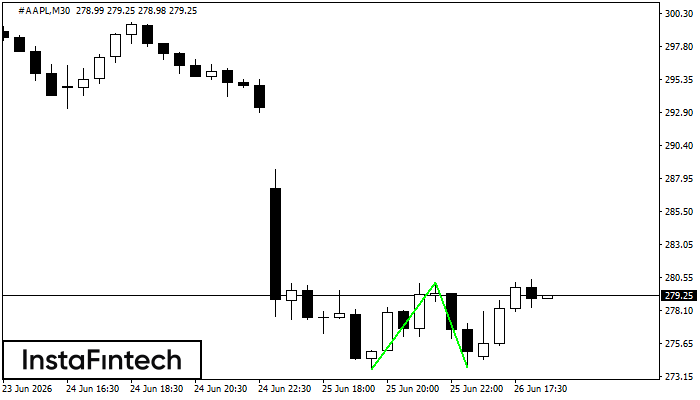
The Double Bottom pattern has been formed on #AAPL M30. This formation signals a reversal of the trend from downwards to upwards. The signal is that a buy trade should be opened after the upper boundary of the pattern 280.17 is broken. The further movements will rely on the width of the current pattern 643 points.
Double Top
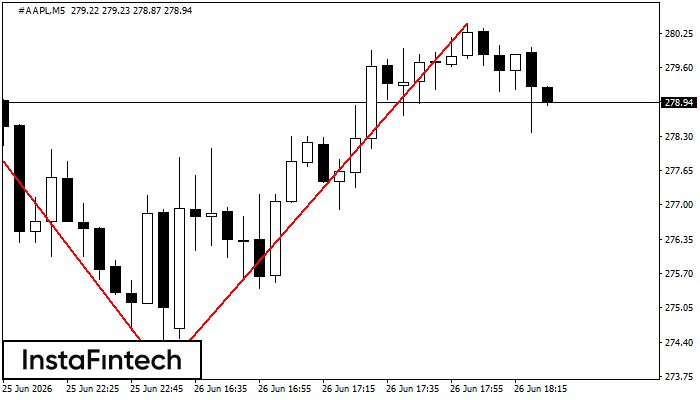
On the chart of #AAPL M5 the Double Top reversal pattern has been formed. Characteristics: the upper boundary 280.43; the lower boundary 273.87; the width of the pattern 656 points. The signal: a break of the lower boundary will cause continuation of the downward trend targeting the 273.72 level.
Double Bottom
The Double Bottom pattern has been formed on #AAPL M15. Characteristics: the support level 273.74; the resistance level 280.17; the width of the pattern 643 points. If the resistance level is broken, a change in the trend can be predicted with the first target point lying at the distance of 630 points.


