


FX.co ★ Actual patterns. Technical analysis and trading recommendations
Actual patterns

Bullish pennant
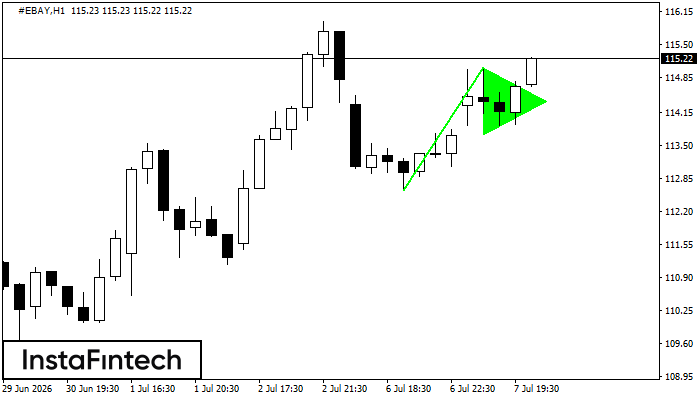
The Bullish pennant graphic pattern has formed on the #EBAY H1 instrument. This pattern type falls under the category of continuation patterns. In this case, if the quote can breaks out high, is expected to continue the upward trend to level 115.44.
Double Bottom
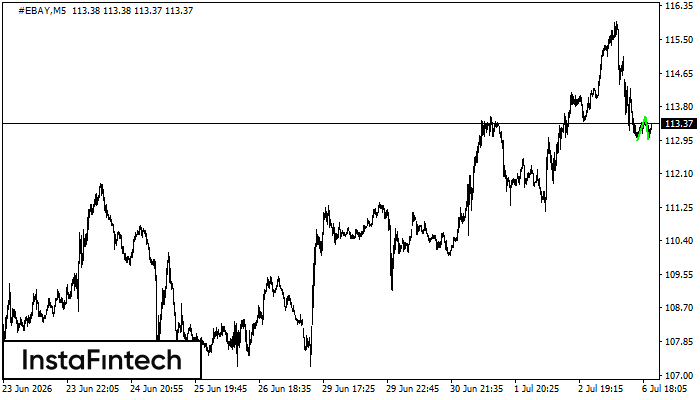
The Double Bottom pattern has been formed on #EBAY M5. This formation signals a reversal of the trend from downwards to upwards. The signal is that a buy trade should be opened after the upper boundary of the pattern 113.55 is broken. The further movements will rely on the width of the current pattern 60 points.
Bullish pennant
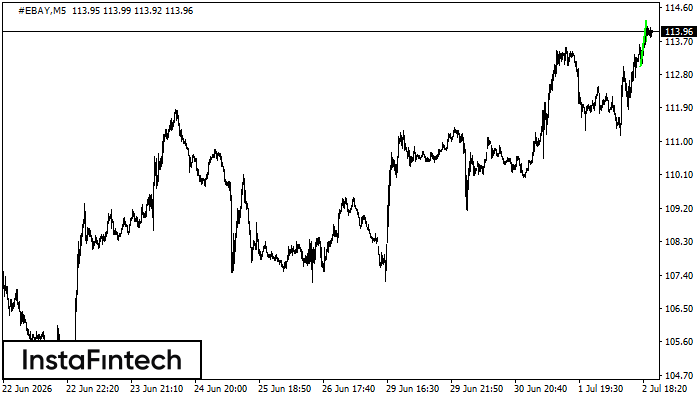
The Bullish pennant graphic pattern has formed on the #EBAY M5 instrument. This pattern type falls under the category of continuation patterns. In this case, if the quote can breaks out high, is expected to continue the upward trend to level 114.41.
Bullish Symmetrical Triangle
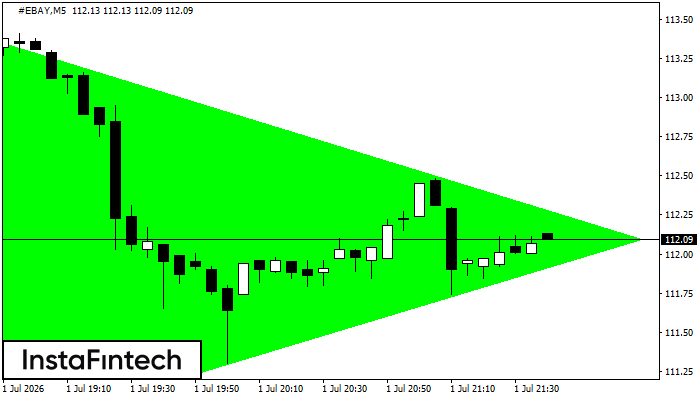
According to the chart of M5, #EBAY formed the Bullish Symmetrical Triangle pattern, which signals the trend will continue. Description. The upper border of the pattern touches the coordinates 113.54/112.09 whereas the lower border goes across 110.67/112.09. The pattern width is measured on the chart at 287 pips. If the Bullish Symmetrical Triangle pattern is in progress during the upward trend, this indicates the current trend will go on. In case 112.09 is broken, the price could continue its move toward 112.24.
Bullish pennant
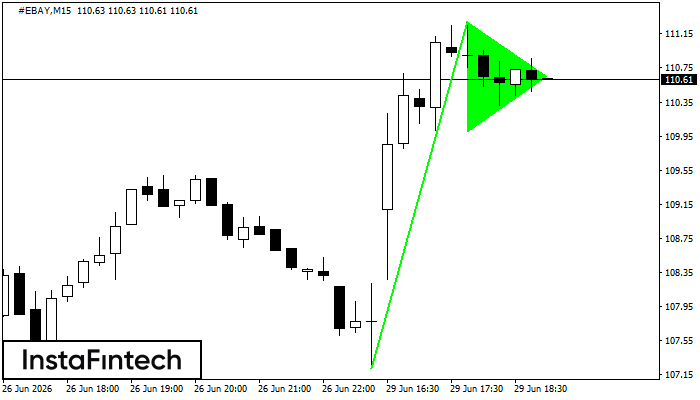
The Bullish pennant graphic pattern has formed on the #EBAY M15 instrument. This pattern type falls under the category of continuation patterns. In this case, if the quote can breaks out high, is expected to continue the upward trend to level 111.51.


