
















FX.co ★ Actual patterns. Technical analysis and trading recommendations
Actual patterns




Bullish Flag
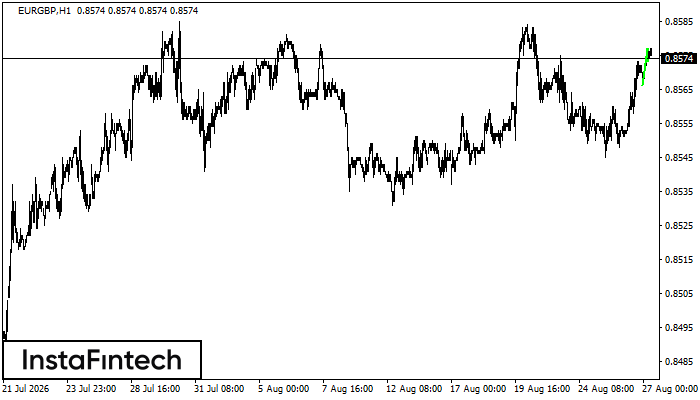
The Bullish Flag continuation pattern has formed on the EURGBP H1 chart. If the price breaks above the pattern high at 0.8577, a long position may be considered with a target at 0.8617.
Double Top
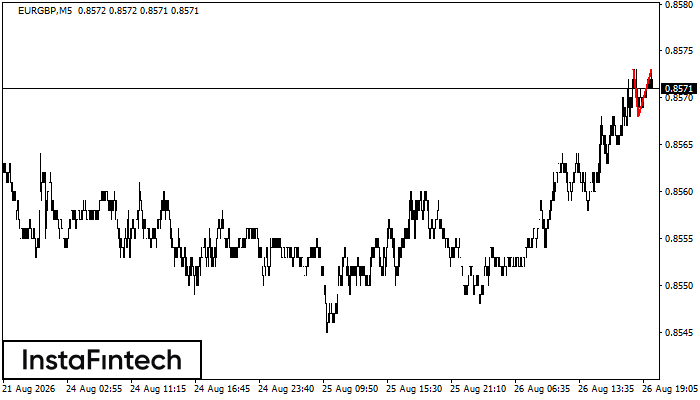
The Double Top pattern has formed on the EURGBP M5 chart and signals a potential reversal from an uptrend to a downtrend. A break below the pattern base at 0.8568 is likely to confirm further downward movement.
Inverse Head and Shoulders
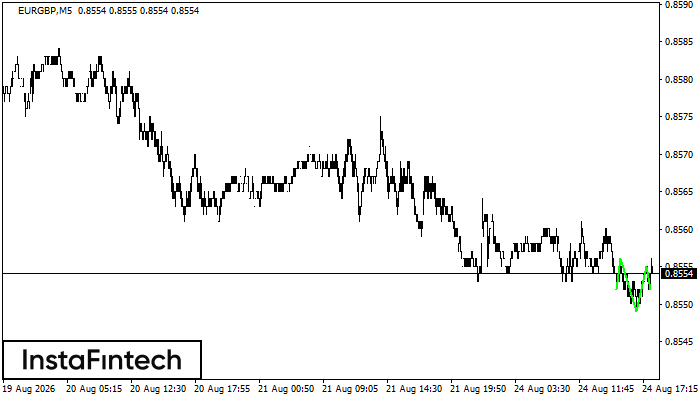
The Inverse Head and Shoulders pattern has formed on the EURGBP M5 chart. A break above the higher of the neckline anchors at 0.8556/0.8555 may confirm the bullish reversal.
Inverse Head and Shoulders
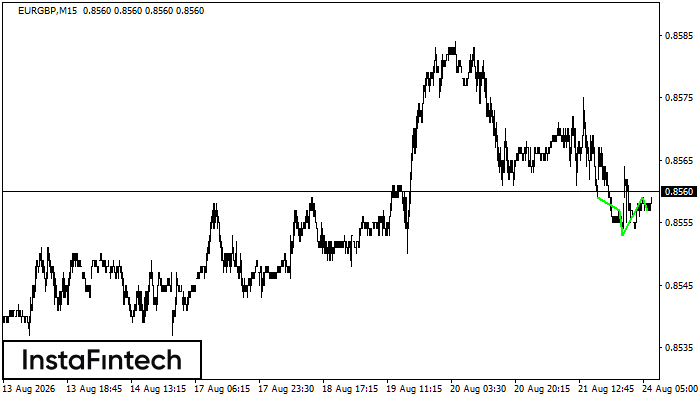
The Inverse Head and Shoulders pattern has formed on the EURGBP M15 chart. The head low is at 0.8553, while the neckline passes through 0.8557/0.8559. The formation of the Inverse Head and Shoulders indicates a potential reversal of the downtrend. A break above the higher neckline anchor may confirm the bullish reversal.
Bearish Flag
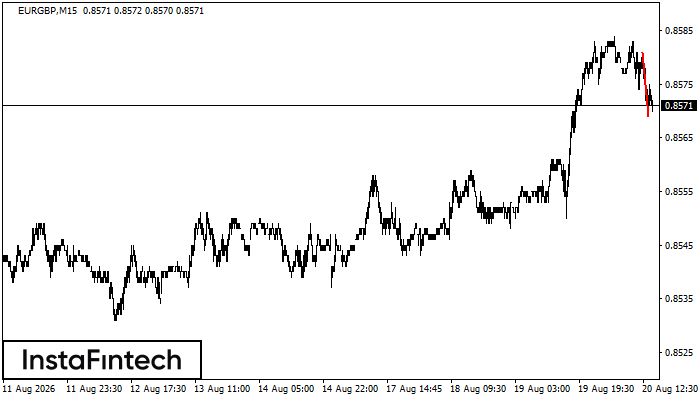
The Bearish Flag pattern has formed on the EURGBP M15 chart. Its lower boundary passes through 0.8569/0.8573, while its upper boundary passes through 0.8573/0.8577. The projected flagpole height is 12 points. The formation indicates that the downtrend is likely to continue. A break below 0.8569 would confirm further downward movement.


