


FX.co ★ Actual patterns. Technical analysis and trading recommendations
Actual patterns

Bullish pennant
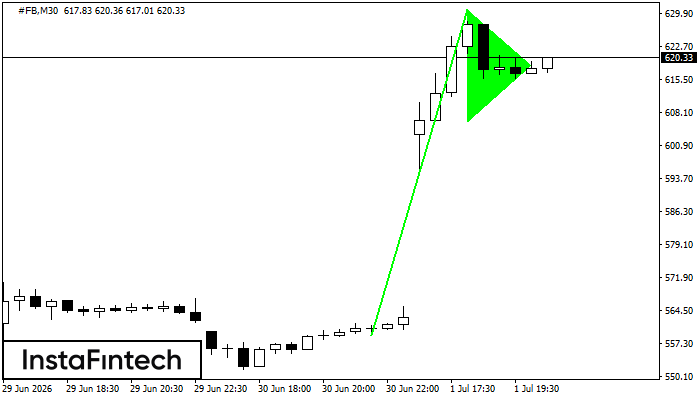
The Bullish pennant signal – Trading instrument #FB M30, continuation pattern. Forecast: it is possible to set up a buy position above the pattern’s high of 630.81, with the prospect of the next move being a projection of the flagpole height.
Bullish pennant
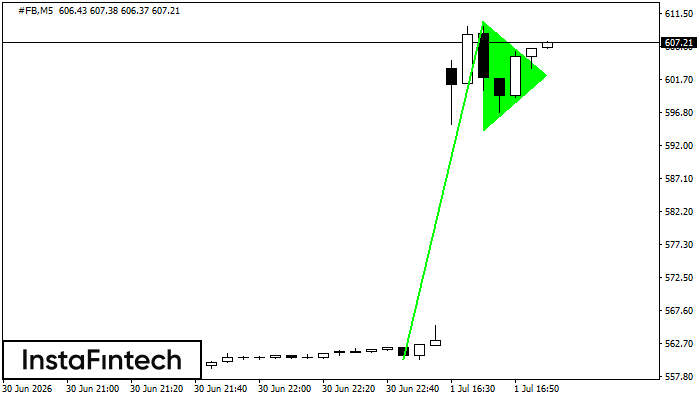
The Bullish pennant graphic pattern has formed on the #FB M5 instrument. This pattern type falls under the category of continuation patterns. In this case, if the quote can breaks out high, is expected to continue the upward trend to level 610.46.
REGISTER
on the forum for traders
AND EARN MONEY!
Register nowon the forum for traders
AND EARN MONEY!
Bearish pennant
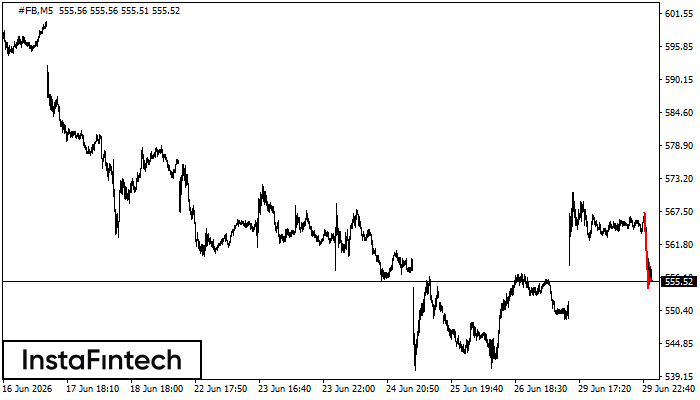
The Bearish pennant pattern has formed on the #FB M5 chart. It signals potential continuation of the existing trend. Specifications: the pattern’s bottom has the coordinate of 554.18; the projection of the flagpole height is equal to 1315 pips. In case the price breaks out the pattern’s bottom of 554.18, the downtrend is expected to continue for further level 554.03.
Double Bottom
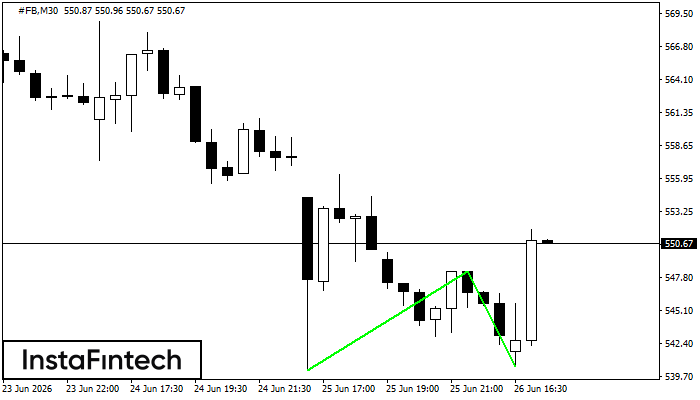
The Double Bottom pattern has been formed on #FB M30; the upper boundary is 548.37; the lower boundary is 540.53. The width of the pattern is 814 points. In case of a break of the upper boundary 548.37, a change in the trend can be predicted where the width of the pattern will coincide with the distance to a possible take profit level.
Double Bottom
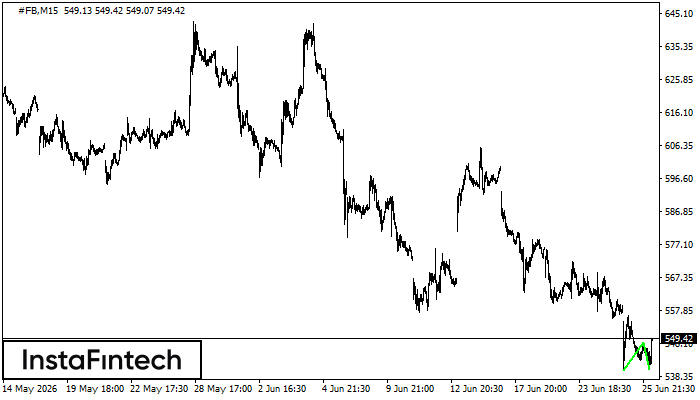
The Double Bottom pattern has been formed on #FB M15; the upper boundary is 548.37; the lower boundary is 540.53. The width of the pattern is 814 points. In case of a break of the upper boundary 548.37, a change in the trend can be predicted where the width of the pattern will coincide with the distance to a possible take profit level.


