


FX.co ★ Actual patterns. Technical analysis and trading recommendations
Actual patterns

Double Top
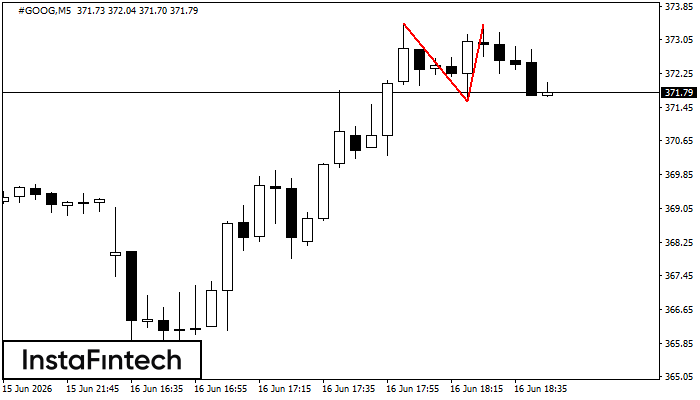
The Double Top pattern has been formed on #GOOG M5. It signals that the trend has been changed from upwards to downwards. Probably, if the base of the pattern 371.59 is broken, the downward movement will continue.
Double Top
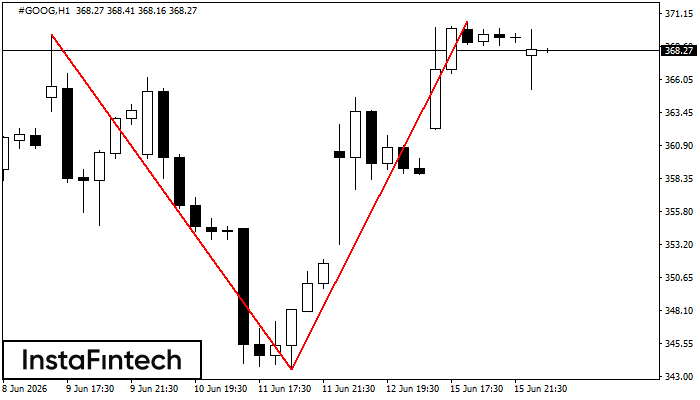
The Double Top pattern has been formed on #GOOG H1. It signals that the trend has been changed from upwards to downwards. Probably, if the base of the pattern 343.54 is broken, the downward movement will continue.
Double Bottom
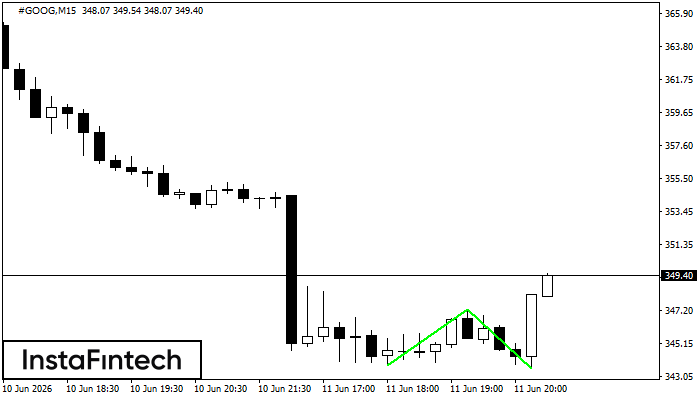
The Double Bottom pattern has been formed on #GOOG M15. This formation signals a reversal of the trend from downwards to upwards. The signal is that a buy trade should be opened after the upper boundary of the pattern 347.29 is broken. The further movements will rely on the width of the current pattern 353 points.
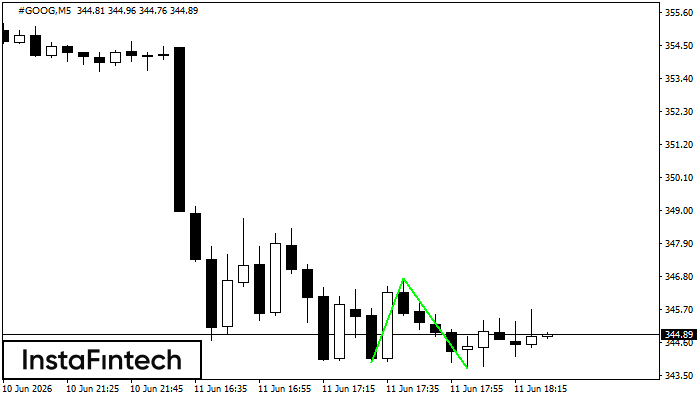
Triple Bottom
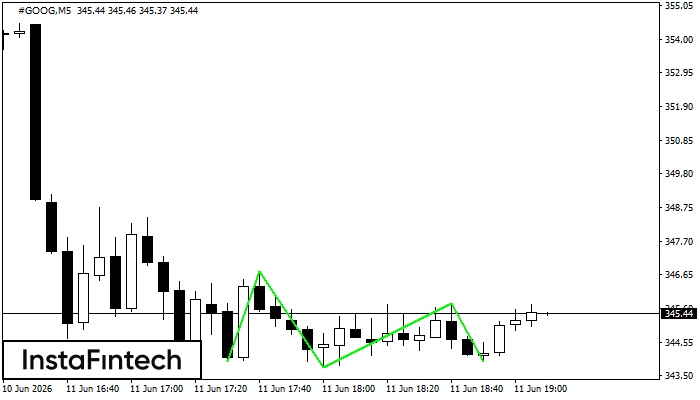
The Triple Bottom pattern has been formed on #GOOG M5. It has the following characteristics: resistance level 346.75/345.77; support level 343.95/343.95; the width is 280 points. In the event of a breakdown of the resistance level of 346.75, the price is likely to continue an upward movement at least to 343.91.
Double Bottom
The Double Bottom pattern has been formed on #GOOG M5. This formation signals a reversal of the trend from downwards to upwards. The signal is that a buy trade should be opened after the upper boundary of the pattern 346.75 is broken. The further movements will rely on the width of the current pattern 280 points.


