


FX.co ★ Actual patterns. Technical analysis and trading recommendations
Actual patterns

Bullish pennant
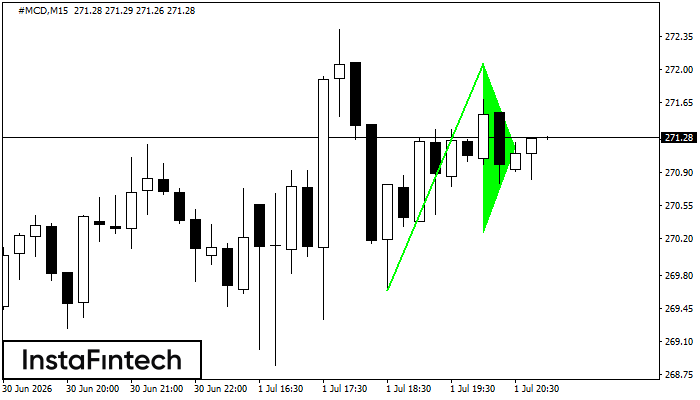
The Bullish pennant pattern is formed on the #MCD M15 chart. It is a type of the continuation pattern. Supposedly, in case the price is fixed above the pennant’s high of 272.07, a further uptrend is possible.
Bearish Symmetrical Triangle
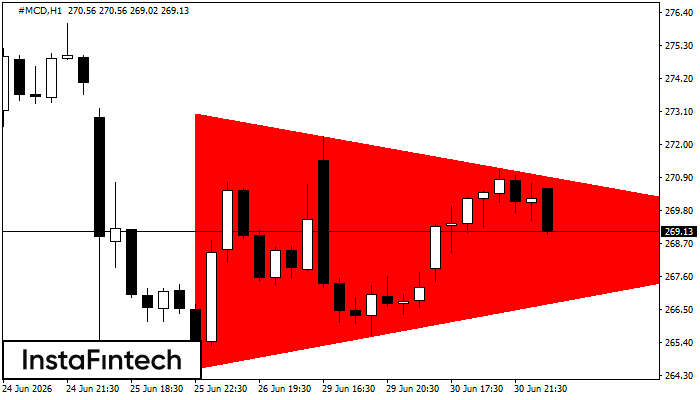
According to the chart of H1, #MCD formed the Bearish Symmetrical Triangle pattern. Trading recommendations: A breach of the lower border 264.56 is likely to encourage a continuation of the downward trend.
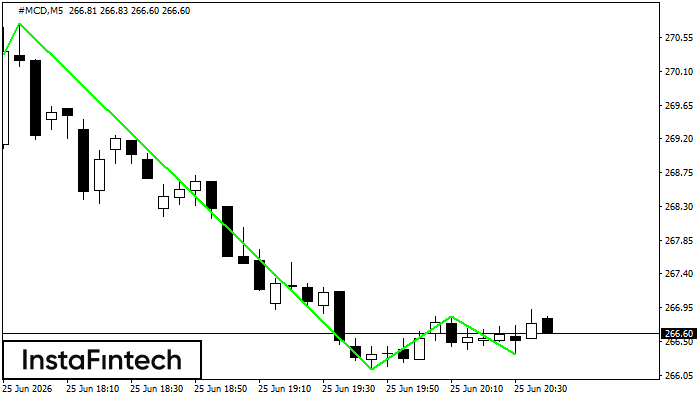
Triple Bottom
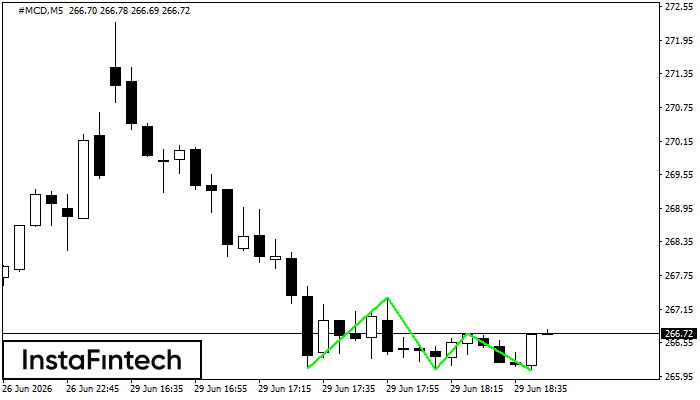
The Triple Bottom pattern has formed on the chart of #MCD M5. Features of the pattern: The lower line of the pattern has coordinates 267.36 with the upper limit 267.36/266.72, the projection of the width is 128 points. The formation of the Triple Bottom pattern most likely indicates a change in the trend from downward to upward. This means that in the event of a breakdown of the resistance level 266.08, the price is most likely to continue the upward movement.
Double Bottom
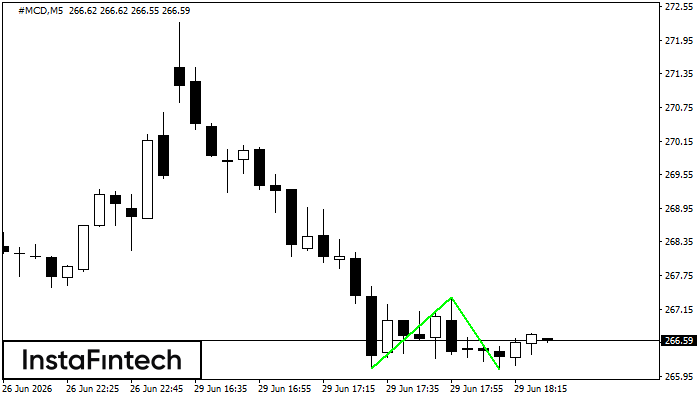
The Double Bottom pattern has been formed on #MCD M5. Characteristics: the support level 266.08; the resistance level 267.36; the width of the pattern 128 points. If the resistance level is broken, a change in the trend can be predicted with the first target point lying at the distance of 129 points.
Triple Bottom
The Triple Bottom pattern has formed on the chart of #MCD M5. Features of the pattern: The lower line of the pattern has coordinates 270.74 with the upper limit 270.74/266.84, the projection of the width is 523 points. The formation of the Triple Bottom pattern most likely indicates a change in the trend from downward to upward. This means that in the event of a breakdown of the resistance level 265.51, the price is most likely to continue the upward movement.


