


FX.co ★ Actual patterns. Technical analysis and trading recommendations
Actual patterns

Double Bottom
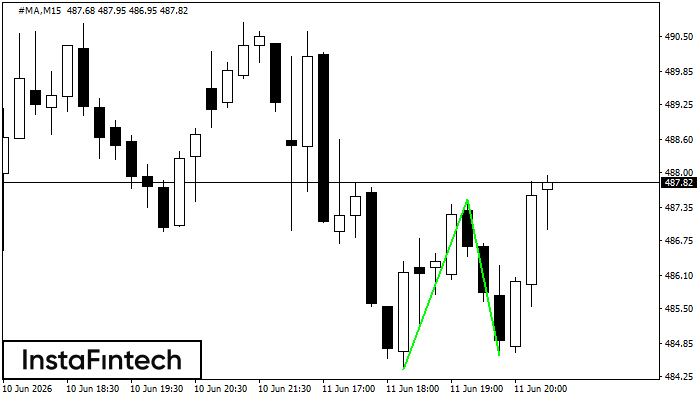
The Double Bottom pattern has been formed on #MA M15. Characteristics: the support level 484.37; the resistance level 487.50; the width of the pattern 313 points. If the resistance level is broken, a change in the trend can be predicted with the first target point lying at the distance of 287 points.
Bullish pennant
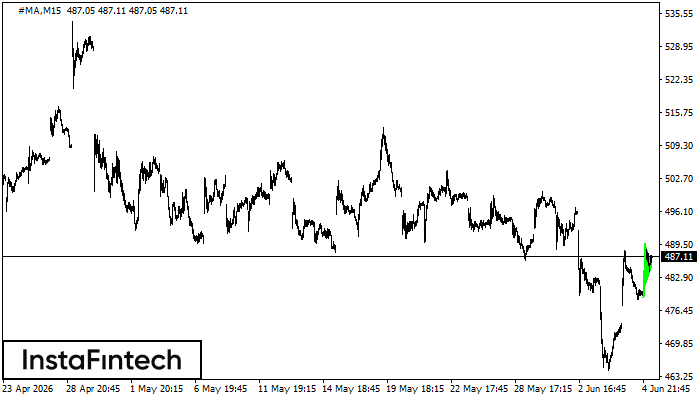
The Bullish pennant pattern is formed on the #MA M15 chart. It is a type of the continuation pattern. Supposedly, in case the price is fixed above the pennant’s high of 489.70, a further uptrend is possible.
Bearish Symmetrical Triangle
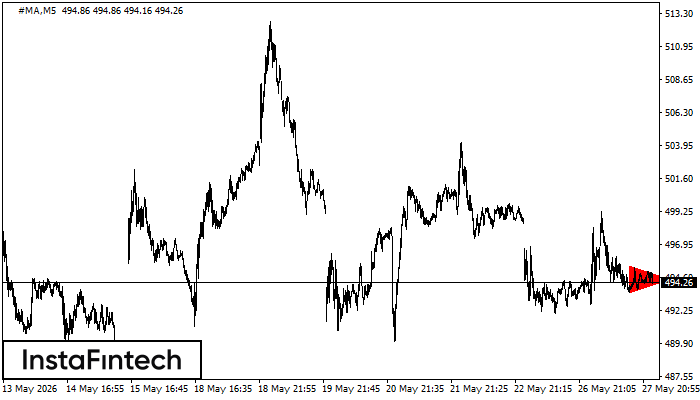
According to the chart of M5, #MA formed the Bearish Symmetrical Triangle pattern. Description: The lower border is 493.54/494.48 and upper border is 495.44/494.48. The pattern width is measured on the chart at -190 pips. The formation of the Bearish Symmetrical Triangle pattern evidently signals a continuation of the downward trend. In other words, if the scenario comes true and #MA breaches the lower border, the price could continue its move toward 494.33.
Double Top
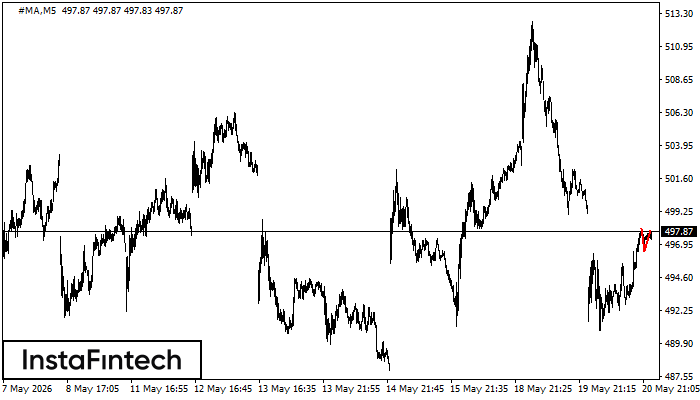
On the chart of #MA M5 the Double Top reversal pattern has been formed. Characteristics: the upper boundary 497.96; the lower boundary 496.46; the width of the pattern 150 points. The signal: a break of the lower boundary will cause continuation of the downward trend targeting the 496.31 level.
Triple Top
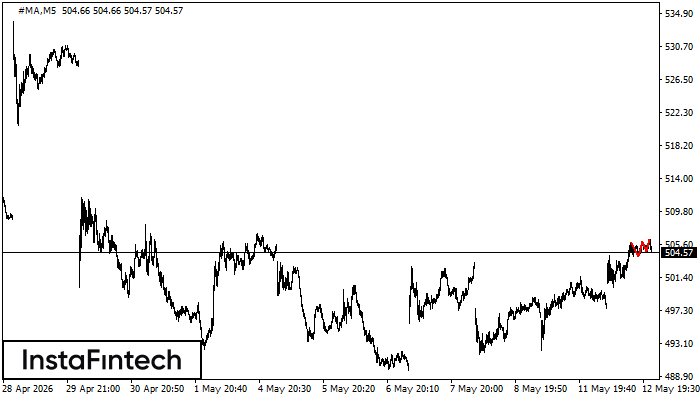
On the chart of the #MA M5 trading instrument, the Triple Top pattern that signals a trend change has formed. It is possible that after formation of the third peak, the price will try to break through the resistance level 504.17, where we advise to open a trading position for sale. Take profit is the projection of the pattern’s width, which is 178 points.


