


FX.co ★ Actual patterns. Technical analysis and trading recommendations
Actual patterns

Double Top
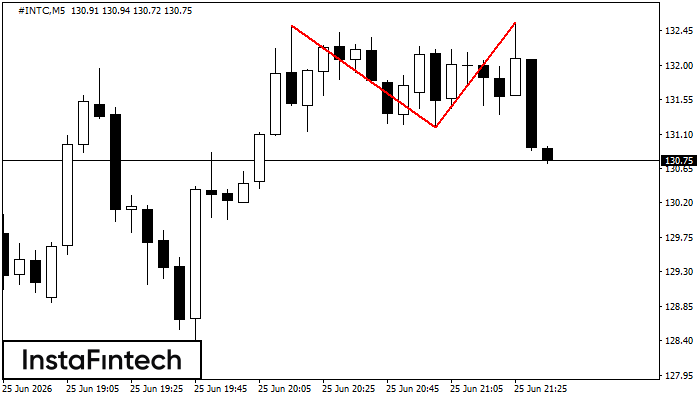
On the chart of #INTC M5 the Double Top reversal pattern has been formed. Characteristics: the upper boundary 132.56; the lower boundary 131.19; the width of the pattern 137 points. The signal: a break of the lower boundary will cause continuation of the downward trend targeting the 131.04 level.
Double Bottom
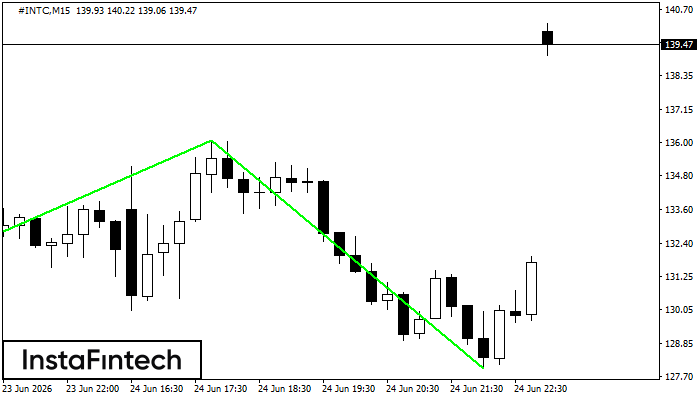
The Double Bottom pattern has been formed on #INTC M15; the upper boundary is 136.05; the lower boundary is 127.98. The width of the pattern is 768 points. In case of a break of the upper boundary 136.05, a change in the trend can be predicted where the width of the pattern will coincide with the distance to a possible take profit level.
Bearish pennant
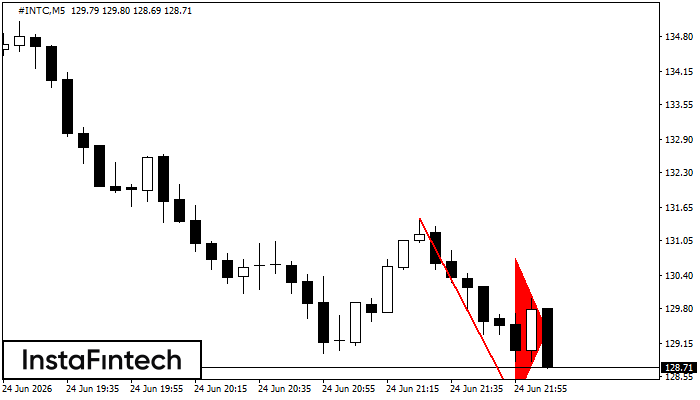
The Bearish pennant pattern has formed on the #INTC M5 chart. The pattern signals continuation of the downtrend in case the pennant’s low of 128.07 is broken through. Recommendations: Place the sell stop pending order 10 pips below the pattern’s low. Place the take profit order at the projection distance of the flagpole height.
Triple Top
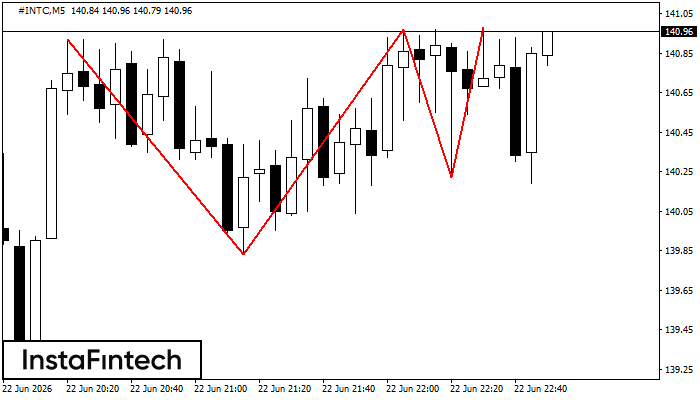
The Triple Top pattern has formed on the chart of the #INTC M5. Features of the pattern: borders have an ascending angle; the lower line of the pattern has the coordinates 139.83/140.22 with the upper limit 140.92/140.98; the projection of the width is 109 points. The formation of the Triple Top figure most likely indicates a change in the trend from upward to downward. This means that in the event of a breakdown of the support level of 139.83, the price is most likely to continue the downward movement.
Head and Shoulders
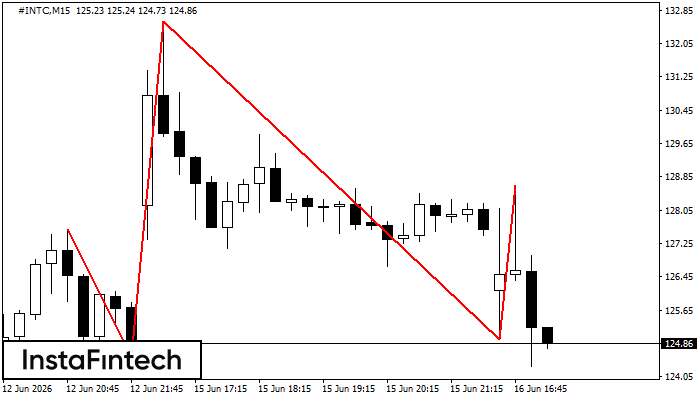
The #INTC M15 formed the Head and Shoulders pattern with the following features: The Head’s top is at 132.57, the Neckline and the upward angle are at 124.55/124.94. The formation of this pattern can bring about changes in the current trend from bullish to bearish. In case the pattern triggers the expected changes, the price of #INTC will go towards 124.71.


