


FX.co ★ Actual patterns. Technical analysis and trading recommendations
Actual patterns

Bullish pennant
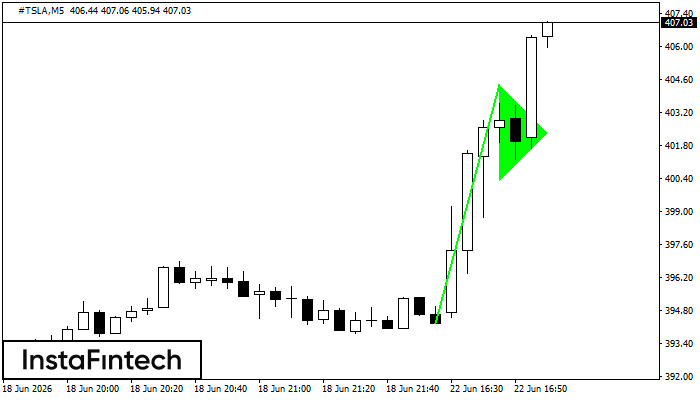
The Bullish pennant signal – Trading instrument #TSLA M5, continuation pattern. Forecast: it is possible to set up a buy position above the pattern’s high of 404.40, with the prospect of the next move being a projection of the flagpole height.
Bullish Symmetrical Triangle
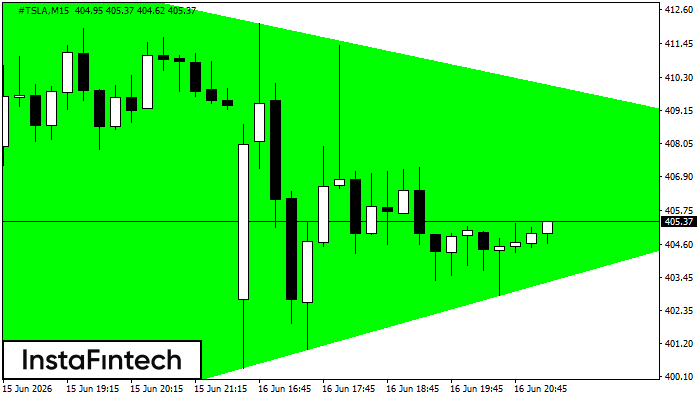
According to the chart of M15, #TSLA formed the Bullish Symmetrical Triangle pattern, which signals the trend will continue. Description. The upper border of the pattern touches the coordinates 414.81/407.16 whereas the lower border goes across 396.97/407.16. The pattern width is measured on the chart at 1784 pips. If the Bullish Symmetrical Triangle pattern is in progress during the upward trend, this indicates the current trend will go on. In case 407.16 is broken, the price could continue its move toward 407.39.
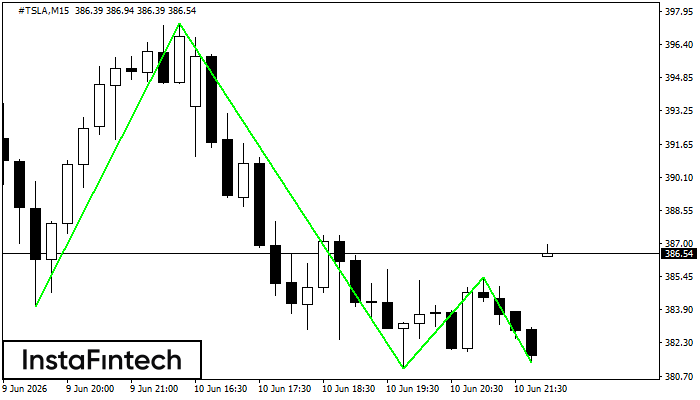
Double Top
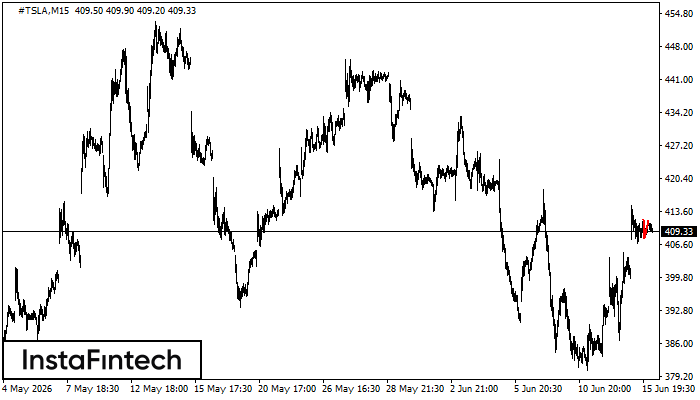
The Double Top pattern has been formed on #TSLA M15. It signals that the trend has been changed from upwards to downwards. Probably, if the base of the pattern 407.85 is broken, the downward movement will continue.
Bullish pennant
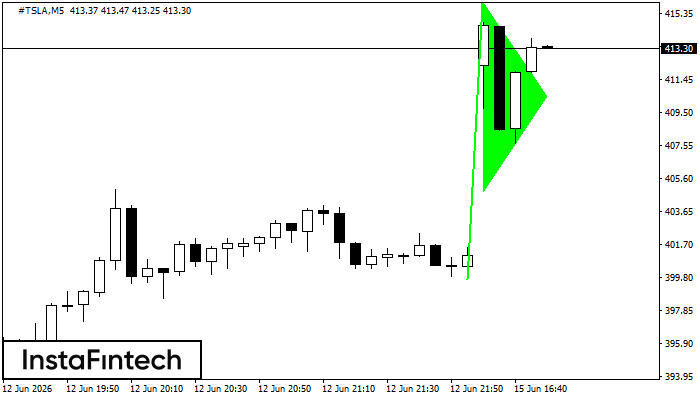
The Bullish pennant signal – Trading instrument #TSLA M5, continuation pattern. Forecast: it is possible to set up a buy position above the pattern’s high of 415.99, with the prospect of the next move being a projection of the flagpole height.
Triple Bottom
The Triple Bottom pattern has formed on the chart of #TSLA M15. Features of the pattern: The lower line of the pattern has coordinates 397.39 with the upper limit 397.39/385.37, the projection of the width is 1335 points. The formation of the Triple Bottom pattern most likely indicates a change in the trend from downward to upward. This means that in the event of a breakdown of the resistance level 384.04, the price is most likely to continue the upward movement.


