


FX.co ★ Actual patterns. Technical analysis and trading recommendations
Actual patterns

Bullish Rectangle
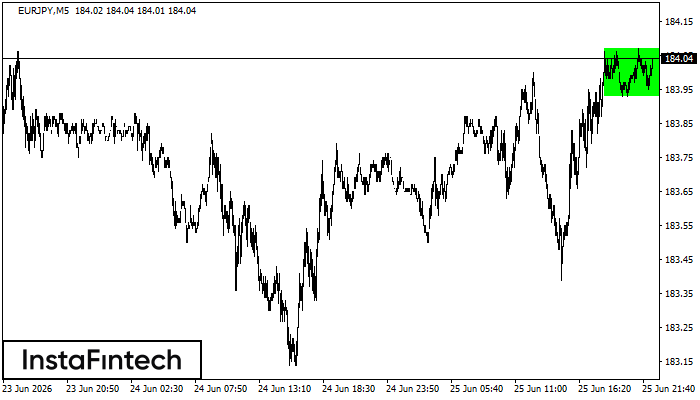
According to the chart of M5, EURJPY formed the Bullish Rectangle. The pattern indicates a trend continuation. The upper border is 184.07, the lower border is 183.93. The signal means that a long position should be opened above the upper border 184.07 of the Bullish Rectangle.
Double Top
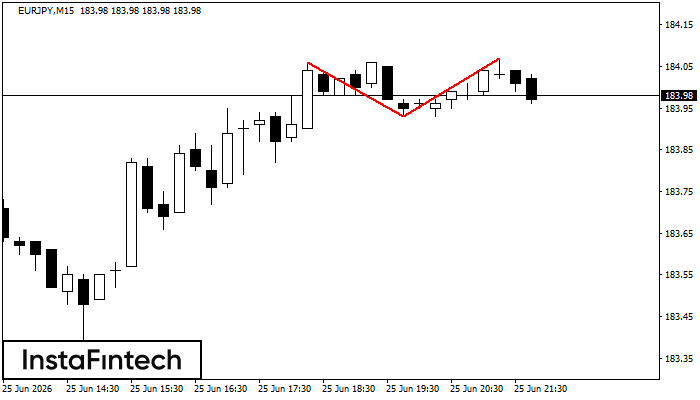
The Double Top reversal pattern has been formed on EURJPY M15. Characteristics: the upper boundary 184.06; the lower boundary 183.93; the width of the pattern is 14 points. Sell trades are better to be opened below the lower boundary 183.93 with a possible movements towards the 183.71 level.
Double Top
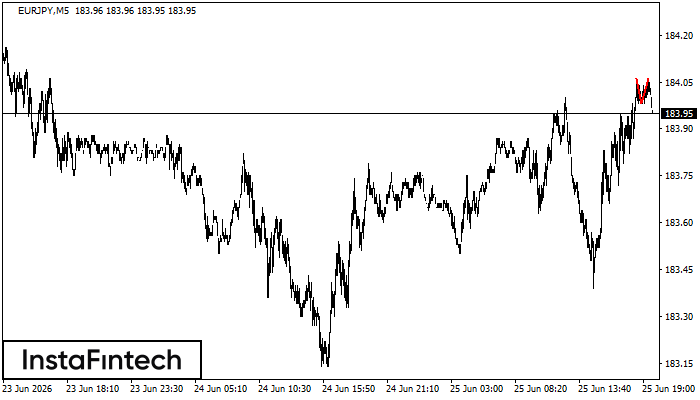
The Double Top pattern has been formed on EURJPY M5. It signals that the trend has been changed from upwards to downwards. Probably, if the base of the pattern 183.98 is broken, the downward movement will continue.
Double Bottom
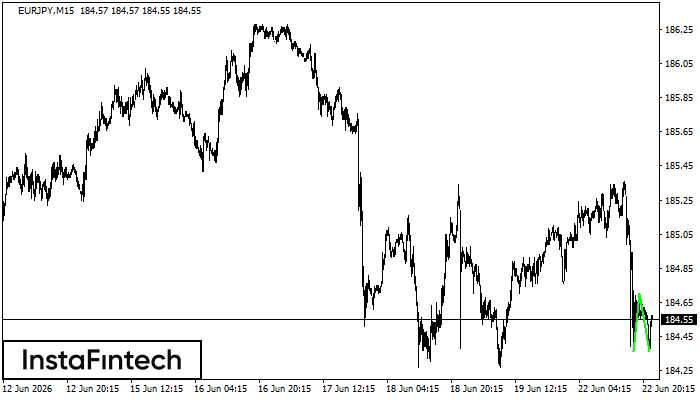
The Double Bottom pattern has been formed on EURJPY M15. This formation signals a reversal of the trend from downwards to upwards. The signal is that a buy trade should be opened after the upper boundary of the pattern 184.70 is broken. The further movements will rely on the width of the current pattern 34 points.
Double Bottom
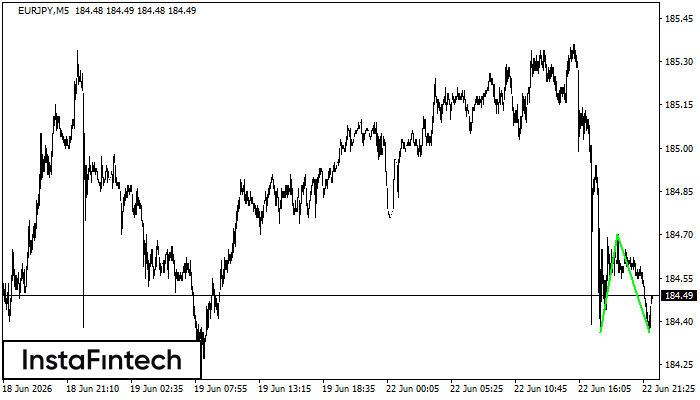
The Double Bottom pattern has been formed on EURJPY M5; the upper boundary is 184.70; the lower boundary is 184.36. The width of the pattern is 34 points. In case of a break of the upper boundary 184.70, a change in the trend can be predicted where the width of the pattern will coincide with the distance to a possible take profit level.


