
















FX.co ★ Actual patterns. Technical analysis and trading recommendations
Actual patterns




Bullish Pennant
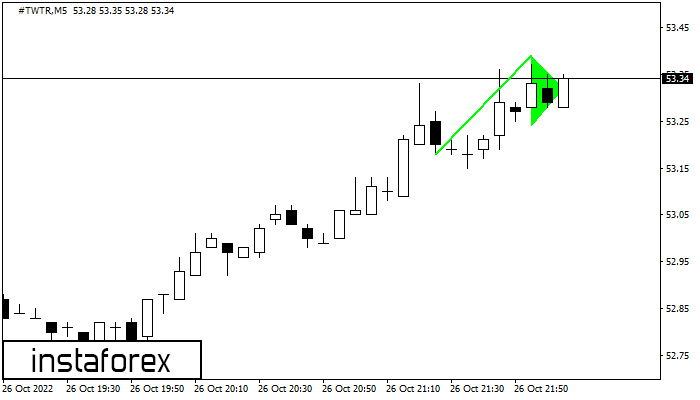
The Bullish Pennant pattern has formed on the #TWTR M5 chart. This is a continuation pattern. If the price closes above the pennant high at 53.39, the uptrend is likely to continue.
Bullish Symmetrical Triangle
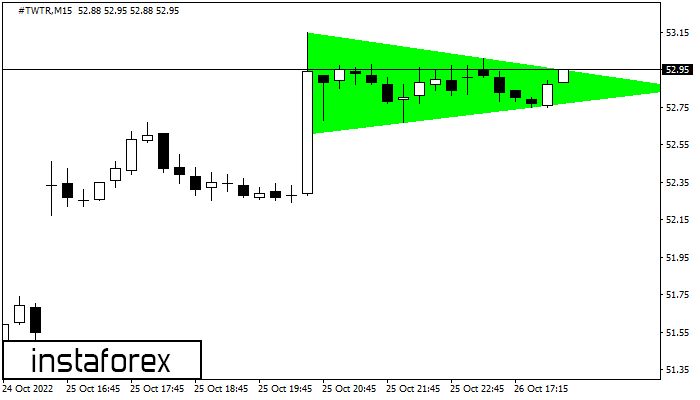
The Bullish Symmetrical Triangle pattern has formed on the #TWTR M15 chart. Its lower boundary passes through 52.61/52.85, while its upper boundary passes through 53.15/52.85. The Bullish Symmetrical Triangle is a continuation pattern and therefore supports a further rise. If confirmed, #TWTR is expected to break the upper boundary and move toward 53.08.
REGISTER
on the forum for traders
AND EARN MONEY!
Register nowon the forum for traders
AND EARN MONEY!
Double Top
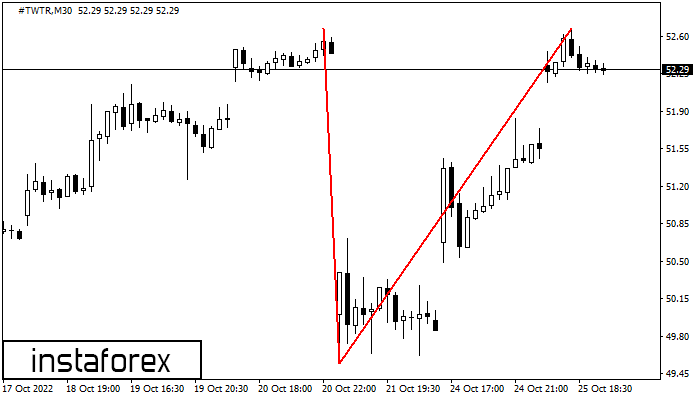
The Double Top reversal pattern has formed on the #TWTR M30 chart. Its upper boundary is at 52.67, its lower boundary is at 49.54, and its width is 313 points. A short position may be considered below the lower boundary at 49.54, with a potential target at 49.24.
Double Top
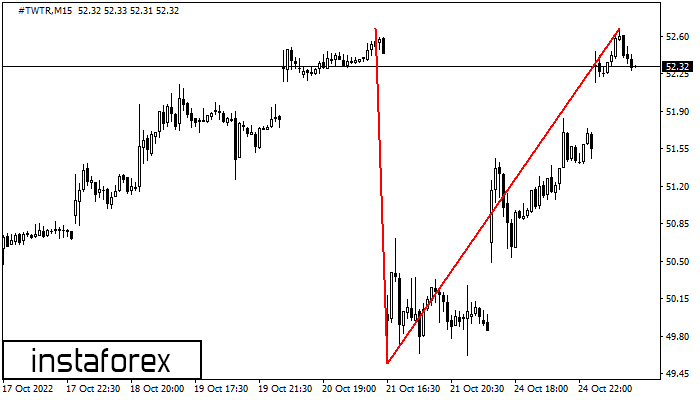
The Double Top reversal pattern has formed on the #TWTR M15 chart. Its upper boundary is at 52.67, its lower boundary is at 49.54, and its width is 313 points. A short position may be considered below the lower boundary at 49.54, with a potential target at 49.31.
Bullish Pennant
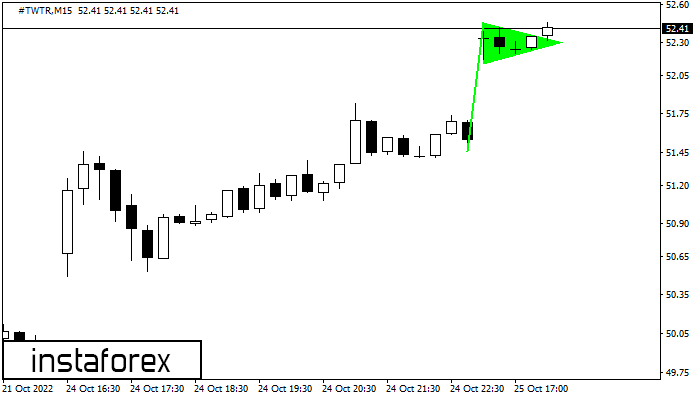
The Bullish Pennant pattern has formed on the #TWTR M15 chart. This is a trend continuation pattern. If the price breaks above the pattern high at 52.46, the uptrend is expected to continue toward 52.69.


