


FX.co ★ Actual patterns. Technical analysis and trading recommendations
Actual patterns

Double Bottom
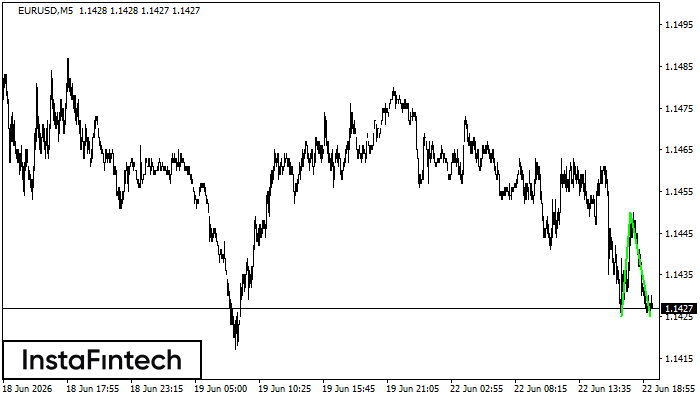
The Double Bottom pattern has been formed on EURUSD M5; the upper boundary is 1.1450; the lower boundary is 1.1425. The width of the pattern is 25 points. In case of a break of the upper boundary 1.1450, a change in the trend can be predicted where the width of the pattern will coincide with the distance to a possible take profit level.
Triple Bottom
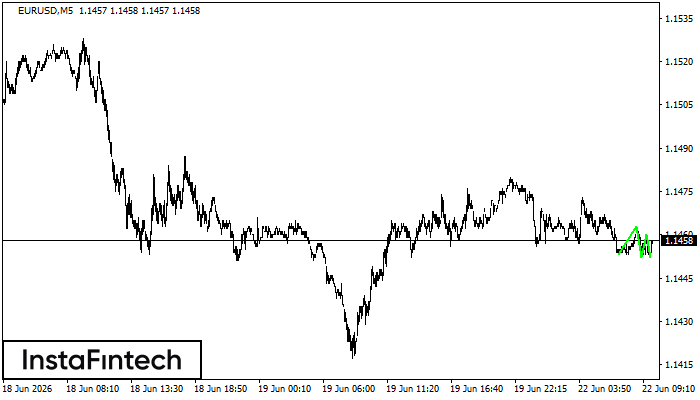
The Triple Bottom pattern has formed on the chart of EURUSD M5. Features of the pattern: The lower line of the pattern has coordinates 1.1463 with the upper limit 1.1463/1.1460, the projection of the width is 10 points. The formation of the Triple Bottom pattern most likely indicates a change in the trend from downward to upward. This means that in the event of a breakdown of the resistance level 1.1453, the price is most likely to continue the upward movement.
Triple Top
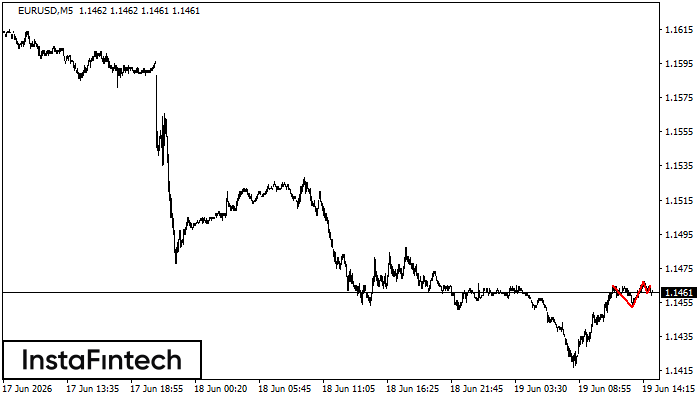
The Triple Top pattern has formed on the chart of the EURUSD M5 trading instrument. It is a reversal pattern featuring the following characteristics: resistance level 0, support level -8, and pattern’s width 13. Forecast If the price breaks through the support level 1.1452, it is likely to move further down to 1.1452.
Double Top
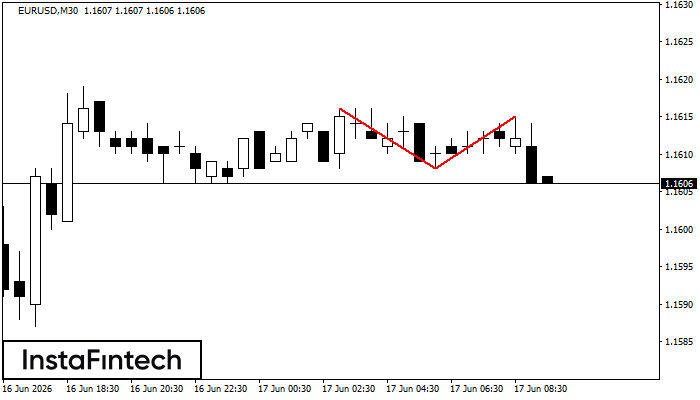
The Double Top pattern has been formed on EURUSD M30. It signals that the trend has been changed from upwards to downwards. Probably, if the base of the pattern 1.1608 is broken, the downward movement will continue.
Bullish Symmetrical Triangle
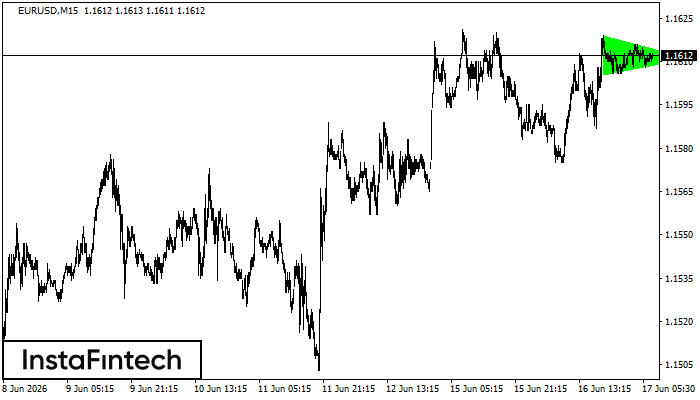
According to the chart of M15, EURUSD formed the Bullish Symmetrical Triangle pattern, which signals the trend will continue. Description. The upper border of the pattern touches the coordinates 1.1619/1.1611 whereas the lower border goes across 1.1605/1.1611. The pattern width is measured on the chart at 14 pips. If the Bullish Symmetrical Triangle pattern is in progress during the upward trend, this indicates the current trend will go on. In case 1.1611 is broken, the price could continue its move toward 1.1633.


