


FX.co ★ Actual patterns. Technical analysis and trading recommendations
Actual patterns

Bullish Rectangle
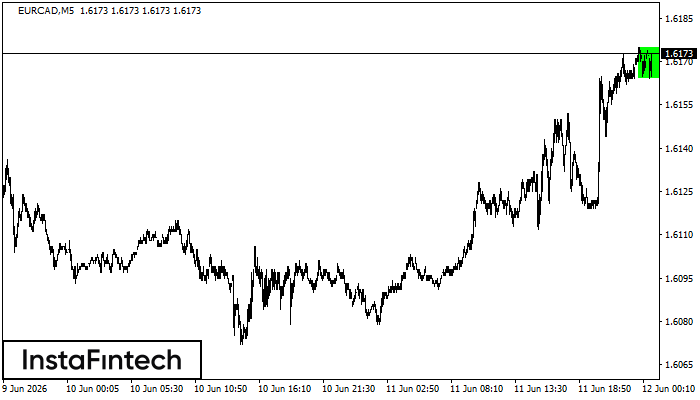
According to the chart of M5, EURCAD formed the Bullish Rectangle which is a pattern of a trend continuation. The pattern is contained within the following borders: the lower border 1.6164 – 1.6164 and upper border 1.6175 – 1.6175. In case the upper border is broken, the instrument is likely to follow the upward trend.
Bearish Symmetrical Triangle
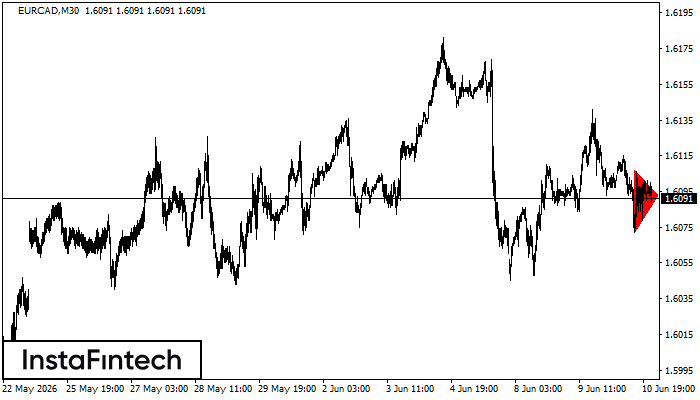
According to the chart of M30, EURCAD formed the Bearish Symmetrical Triangle pattern. This pattern signals a further downward trend in case the lower border 1.6072 is breached. Here, a hypothetical profit will equal the width of the available pattern that is -35 pips.
Bearish Symmetrical Triangle
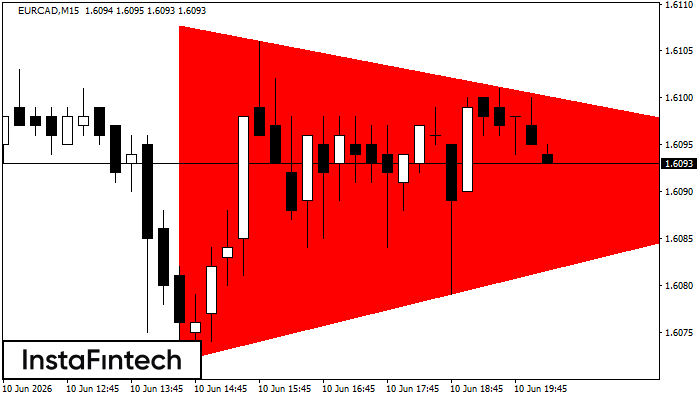
According to the chart of M15, EURCAD formed the Bearish Symmetrical Triangle pattern. Description: The lower border is 1.6072/1.6092 and upper border is 1.6108/1.6092. The pattern width is measured on the chart at -36 pips. The formation of the Bearish Symmetrical Triangle pattern evidently signals a continuation of the downward trend. In other words, if the scenario comes true and EURCAD breaches the lower border, the price could continue its move toward 1.6070.
Inverse Head and Shoulder
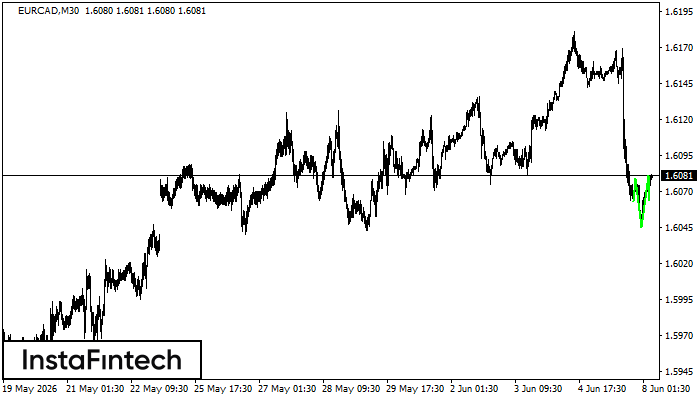
According to M30, EURCAD is shaping the technical pattern – the Inverse Head and Shoulder. In case the Neckline 1.6079/1.6081 is broken out, the instrument is likely to move toward 1.6111.
Inverse Head and Shoulder
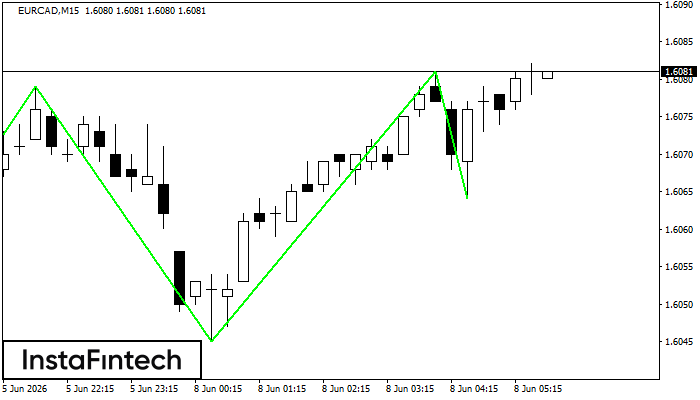
According to the chart of M15, EURCAD produced the pattern termed the Inverse Head and Shoulder. The Head is fixed at 1.6045 while the median line of the Neck is set at 1.6079/1.6081. The formation of the Inverse Head and Shoulder Pattern clearly indicates a reversal of the downward trend. In means that in case the scenario comes true, the price of EURCAD will go towards 1.6104.


