


FX.co ★ Actual patterns. Technical analysis and trading recommendations
Actual patterns

Double Top
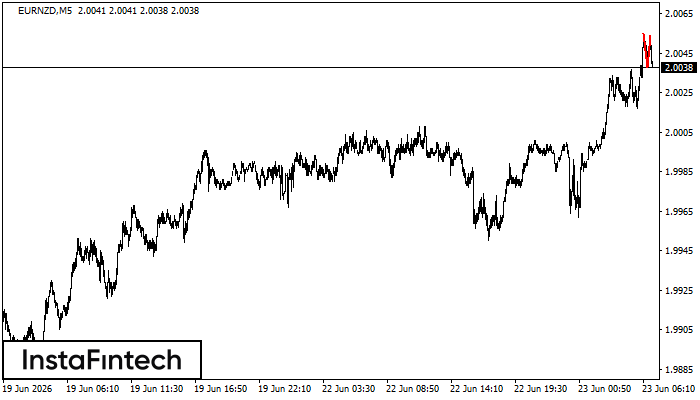
The Double Top pattern has been formed on EURNZD M5. It signals that the trend has been changed from upwards to downwards. Probably, if the base of the pattern 2.0038 is broken, the downward movement will continue.
Double Top
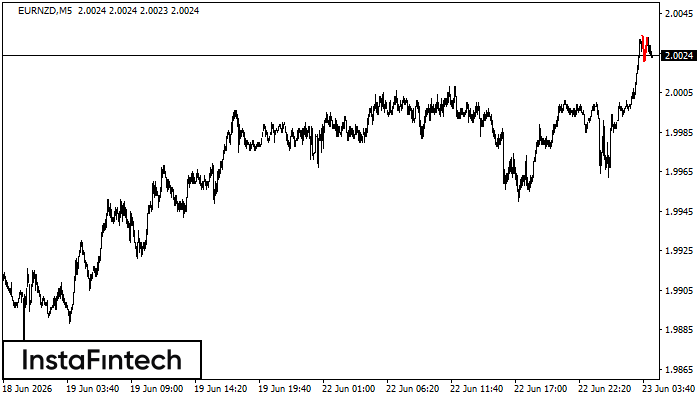
The Double Top reversal pattern has been formed on EURNZD M5. Characteristics: the upper boundary 2.0034; the lower boundary 2.0021; the width of the pattern is 12 points. Sell trades are better to be opened below the lower boundary 2.0021 with a possible movements towards the 2.0006 level.
Bullish Rectangle
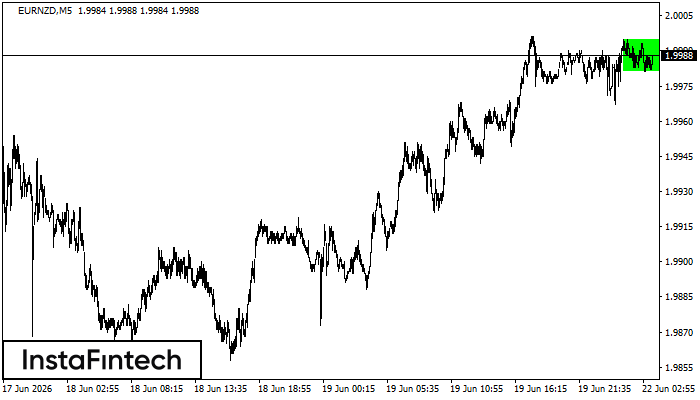
According to the chart of M5, EURNZD formed the Bullish Rectangle which is a pattern of a trend continuation. The pattern is contained within the following borders: the lower border 1.9981 – 1.9981 and upper border 1.9995 – 1.9995. In case the upper border is broken, the instrument is likely to follow the upward trend.
Double Bottom
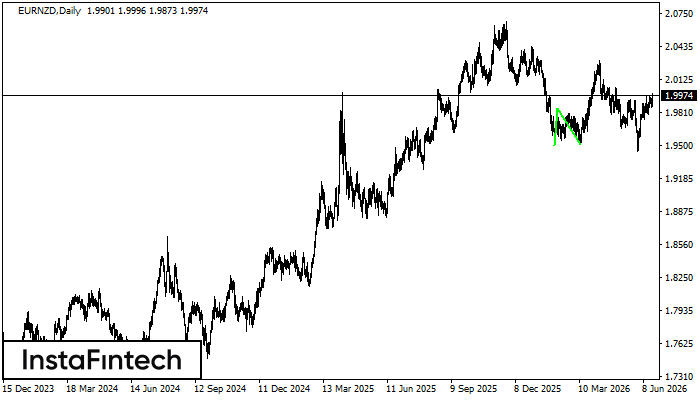
The Double Bottom pattern has been formed on EURNZD D1; the upper boundary is 1.9851; the lower boundary is 1.9509. The width of the pattern is 355 points. In case of a break of the upper boundary 1.9851, a change in the trend can be predicted where the width of the pattern will coincide with the distance to a possible take profit level.


