


FX.co ★ Actual patterns. Technical analysis and trading recommendations
Actual patterns

Double Top
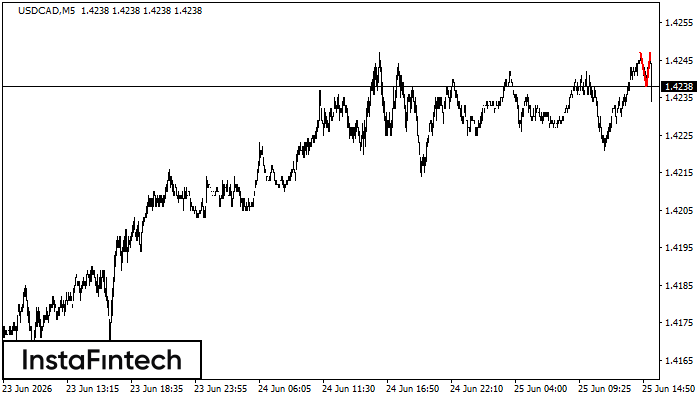
On the chart of USDCAD M5 the Double Top reversal pattern has been formed. Characteristics: the upper boundary 1.4247; the lower boundary 1.4238; the width of the pattern 9 points. The signal: a break of the lower boundary will cause continuation of the downward trend targeting the 1.4223 level.
Bearish Symmetrical Triangle
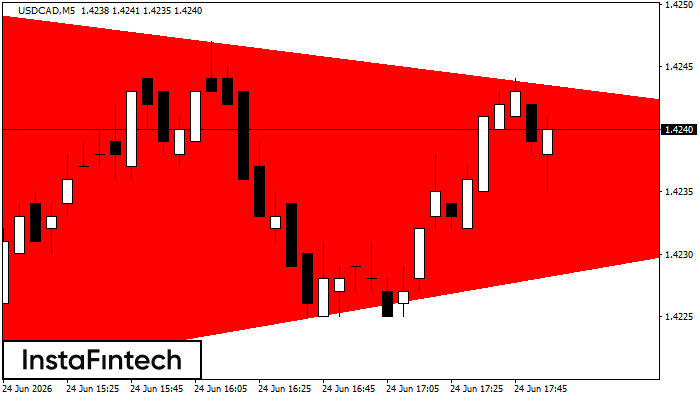
According to the chart of M5, USDCAD formed the Bearish Symmetrical Triangle pattern. This pattern signals a further downward trend in case the lower border 1.4220 is breached. Here, a hypothetical profit will equal the width of the available pattern that is -30 pips.
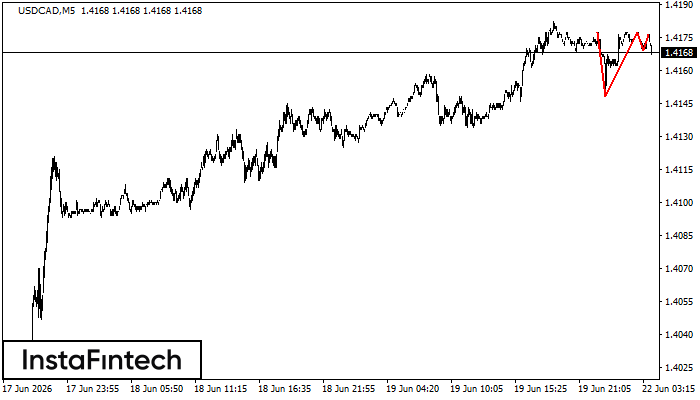
Head and Shoulders
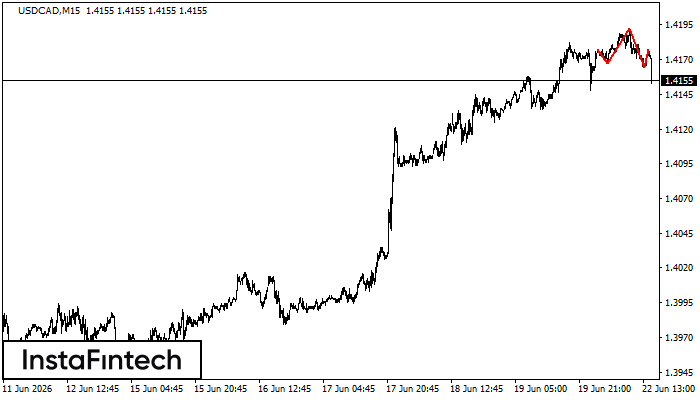
The technical pattern called Head and Shoulders has appeared on the chart of USDCAD M15. There are weighty reasons to suggest that the price will surpass the Neckline 1.4167/1.4164 after the right shoulder has been formed. So, the trend is set to change with the price heading for 1.4141.
Triple Top
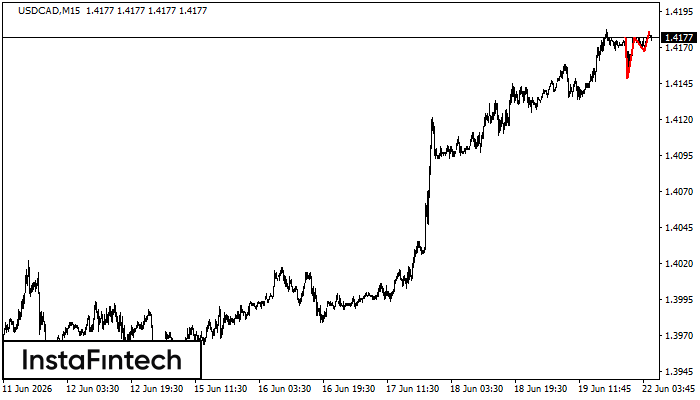
The Triple Top pattern has formed on the chart of the USDCAD M15. Features of the pattern: borders have an ascending angle; the lower line of the pattern has the coordinates 1.4148/1.4167 with the upper limit 1.4177/1.4181; the projection of the width is 29 points. The formation of the Triple Top figure most likely indicates a change in the trend from upward to downward. This means that in the event of a breakdown of the support level of 1.4148, the price is most likely to continue the downward movement.
Triple Top
The Triple Top pattern has formed on the chart of the USDCAD M5. Features of the pattern: borders have an ascending angle; the lower line of the pattern has the coordinates 1.4148/1.4169 with the upper limit 1.4177/1.4176; the projection of the width is 29 points. The formation of the Triple Top figure most likely indicates a change in the trend from upward to downward. This means that in the event of a breakdown of the support level of 1.4148, the price is most likely to continue the downward movement.


