Main Quotes Calendar Forum
flag

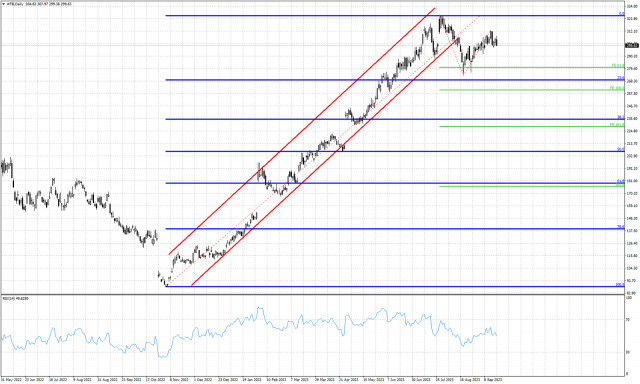
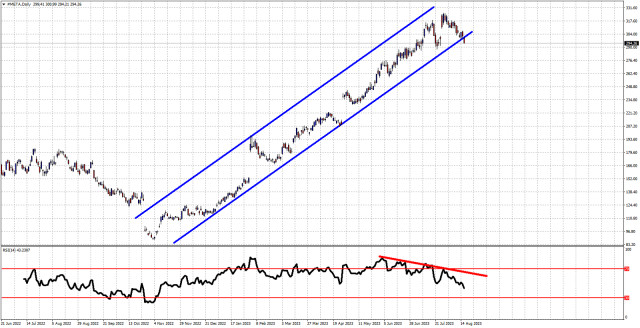
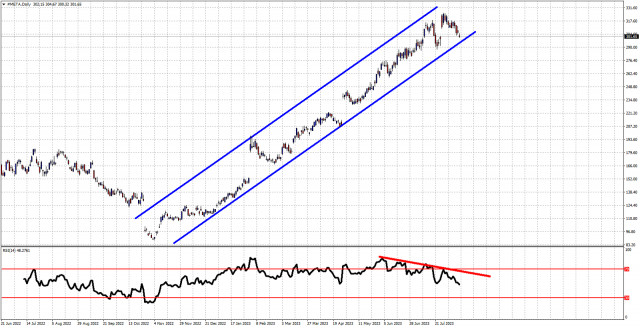
#FB | Facebook, Inc. Stock Price

Facebook, Inc.
Ask
Bid
rise fall
#FB
710.48
710.38
Open :720.73
-10.35(-1.46%)
24 hours:-12.85(-1.81%)
7 days:-11.19(-1.58%)
Day's range:709.94-724
30 days:+14.01(+1.97%)
52 weeks:442.55-747.83
Buy33%
Sell67%
Trade Now

Recommended Articles

Analysis News:::2025-04-30
US Market News Digest for April 30
https://forex-images.ifxdb.com/userfiles/20250430/appsimage_analytics6811e62b9cc78.jpg
US stock indices remain on a positive trajectory, but market pressure has intensified due to a sharp drop in Super Micro shares and the upcoming earnings reports from tech heavyweights...
Analysis News:::2025-03-04
US Market News Digest for March 4
https://forex-images.ifxdb.com/userfiles/20250304/appsimage_analytics67c6e55b3456d.jpg
The S&P 500 and NASDAQ indices continue to fall amid growing concerns over the trade war and the impact of tariffs imposed by US President Donald Trump. This has sent...
Crypto Analysis:::2024-02-05
Technical Analysis of BTC/USD for February 5, 2024
https://forex-images.ifxdb.com/userfiles/20240205/appsimage_analytics65c0b8861a6b2.jpg
Spotlight on Bitcoin's Market Dynamics as Bulls Gather Strength Key Takeaways: Facebook and Instagram's Advertising Shift: Facebook and Instagram now permit advertising for Bitcoin ETFs, significantly broadening cryptocurrency exposure...
Forex Analysis:::2023-11-27
Oil continues falling
https://forex-images.ifxdb.com/userfiles/20231127/appsimage_analytics65646664b43a9.jpg
Oil has fallen for the fourth consecutive trading day as traders have been waiting for the postponed OPEC+ meeting this week. The global benchmark, Brent crude, dropped to $80...
Forex Analysis:::2023-10-26
US premarket on October 26: US stock market continues its sharp decline
https://forex-images.ifxdb.com/userfiles/20231026/appsimage_analytics653a5c99f36ce.jpg
US stock futures opened lower following the release of several corporate reports from major American companies. S&P 500 futures dropped 0.8%, while the tech-heavy NASDAQ plummeted by 1.0%. Meta Platforms...
Forex Analysis:::2023-10-25
US premarket on October 25: US stock market momentum stalls
https://forex-images.ifxdb.com/userfiles/20231025/appsimage_analytics6538fe7c86e4e.jpg
US stock futures opened lower following several failed attempts to break beyond the previous day's highs. The S&P 500 futures dropped by 0.2%, while the tech-heavy NASDAQ declined by 0.3%...
Forex Analysis:::2023-09-21
Technical analysis on META stock price for September 21st, 2023.
https://forex-images.ifxdb.com/userfiles/20230921/appsimage_analytics650c369e5a566.jpg
META stock price is trading around $299. Price has broken out of the red upward sloping channel, reached very close to the 23.6% Fibonacci retracement, bounced towards $312 and formed...
Forex Analysis:::2023-08-16
META stock price exits bullish channel.
https://forex-images.ifxdb.com/userfiles/20230816/appsimage_analytics64dd3d34be8e9.jpg
META stock price is now trading outside of the blue upward sloping channel it was in since November of 2022. Price showed several warning signals over the last few sessions...
Forex Analysis:::2023-08-14
META stock price very close to providing a bearish reversal signal.
https://forex-images.ifxdb.com/userfiles/20230814/appsimage_analytics64da1a613a39a.jpg
META stock price has been trading inside the blue upward sloping channel since November of 2022. Price continues making higher highs and higher lows. Bulls remain in control...
Forex Analysis:::2023-07-28
META stock price remains inside bullish channel
https://forex-images.ifxdb.com/userfiles/20230728/appsimage_analytics64c3bd5e07c6b.jpg
META stock price continues making higher highs and higher lows inside the red upward sloping channel. Technically trend remains bullish as the channel boundaries have not yet been breached. There...
loader...
all-was_read__icon
You have watched all the best publications
presently.
We are already looking for something interesting for you...
all-was_read__star
Recently published:
loader...
More recent publications...