
Technical Analysis on the USD/CHF Currency Pair (H1, H4) Greetings, colleagues! Yesterday, the USD/CHF currency pair tested the lows, which eventually led to a liquidity withdrawal in the imbalance zone. Subsequently, buyers decided to reverse the movement, as indicated by the spike formation on the hourly timeframe. Today, we are facing a similar situation, with a key high located at 0.84744. If we observe movement towards this level, the situation could change significantly. On the hourly timeframe chart, we can see that since the last local weekly high, the price of the USD/CAD currency pair has started forming linear regression channels, showing clear price behavior. Currently, I am considering positions with a pullback and a breakout at the upper boundary of the descending channel. However, based on volumes, we will likely go long as important news is expected to impact price dynamics in the future. In terms of levels, if we aim for a long-term uptrend, we need to target resistance at 0.84321. If we experience a pullback, we will consider selling in the long term as an order block will form in that area. A similar situation can be observed for support levels, with the weekly support located in the range of 0.83230, where an order block is also expected. Overall, I am currently focusing on buying positions but will explore a couple more scenarios.
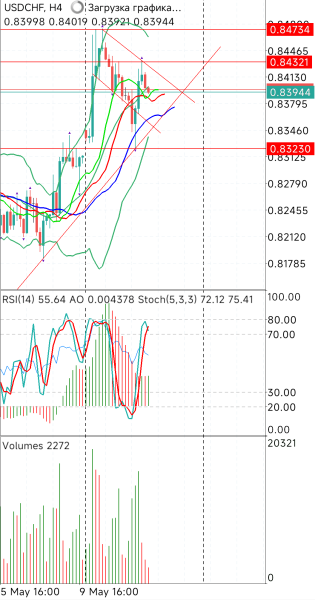
H4 Timeframe On the higher timeframe, we are already receiving a signal for a long-term sell. It seems that a correction is taking place on the hourly timeframe, so I am not considering going long on the higher timeframe at the moment. Regarding support levels, no significant changes are observed yet. The potential movement towards the demand zone at 0.8265 is being considered, with the closest support level currently ranging around 0.8334. From there, we will either anticipate a continuation of the downtrend or a pullback. Looking at the chart, we can see that on the higher timeframes, the price has formed an ascending channel, with its current target being a horizontal zone. Additionally, on the 4-hour chart, the key resistance level towards which the price was heading is at 0.8600. However, we experienced a pullback from that level. Testing is still pending. As we can see, the price failed to surpass the key historical high, so I am considering selling for the long term towards 0.8265. That's all for now. Wishing everyone profitable trading.