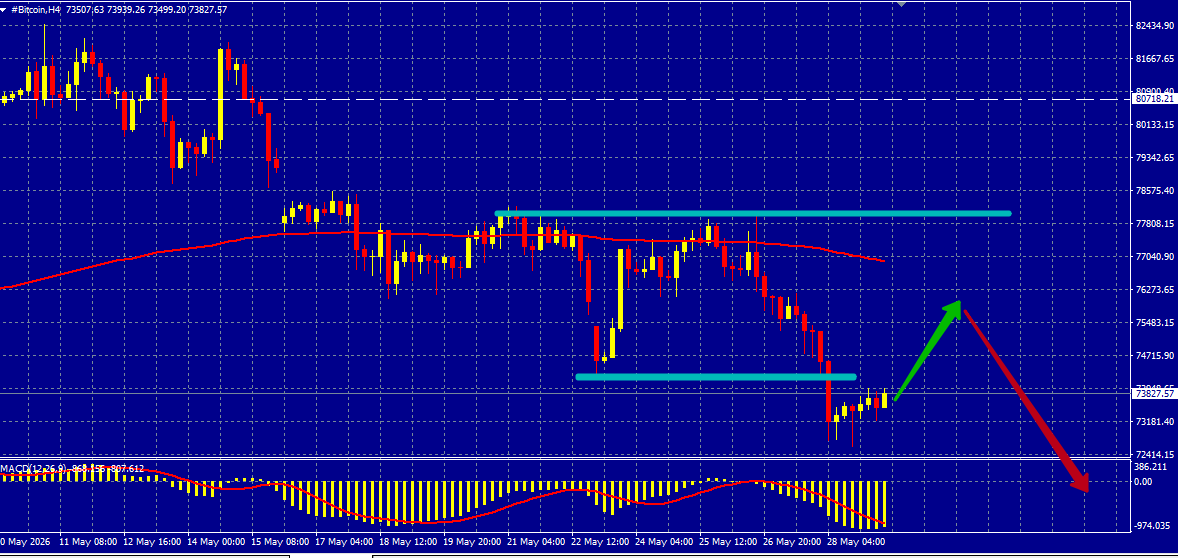
#Bitcoin Hello colleagues! Bitcoin confidently dropped below the minimum extreme of 74200. The bottom was marked at 72600. The closing of the last candles indicates a potential north zigzag correction within the range. I assume a zigzag to the north towards the range of 75200-75400. From there, one can sell with new force until breaking the minimum extreme of 74200, then the path will open up for a breakthrough to the round mark of 70000. On higher timeframes, the trend is bearish, so it is correct to consider selling according to the trend. Updates of minimum extremes also suggest a possible price decline.