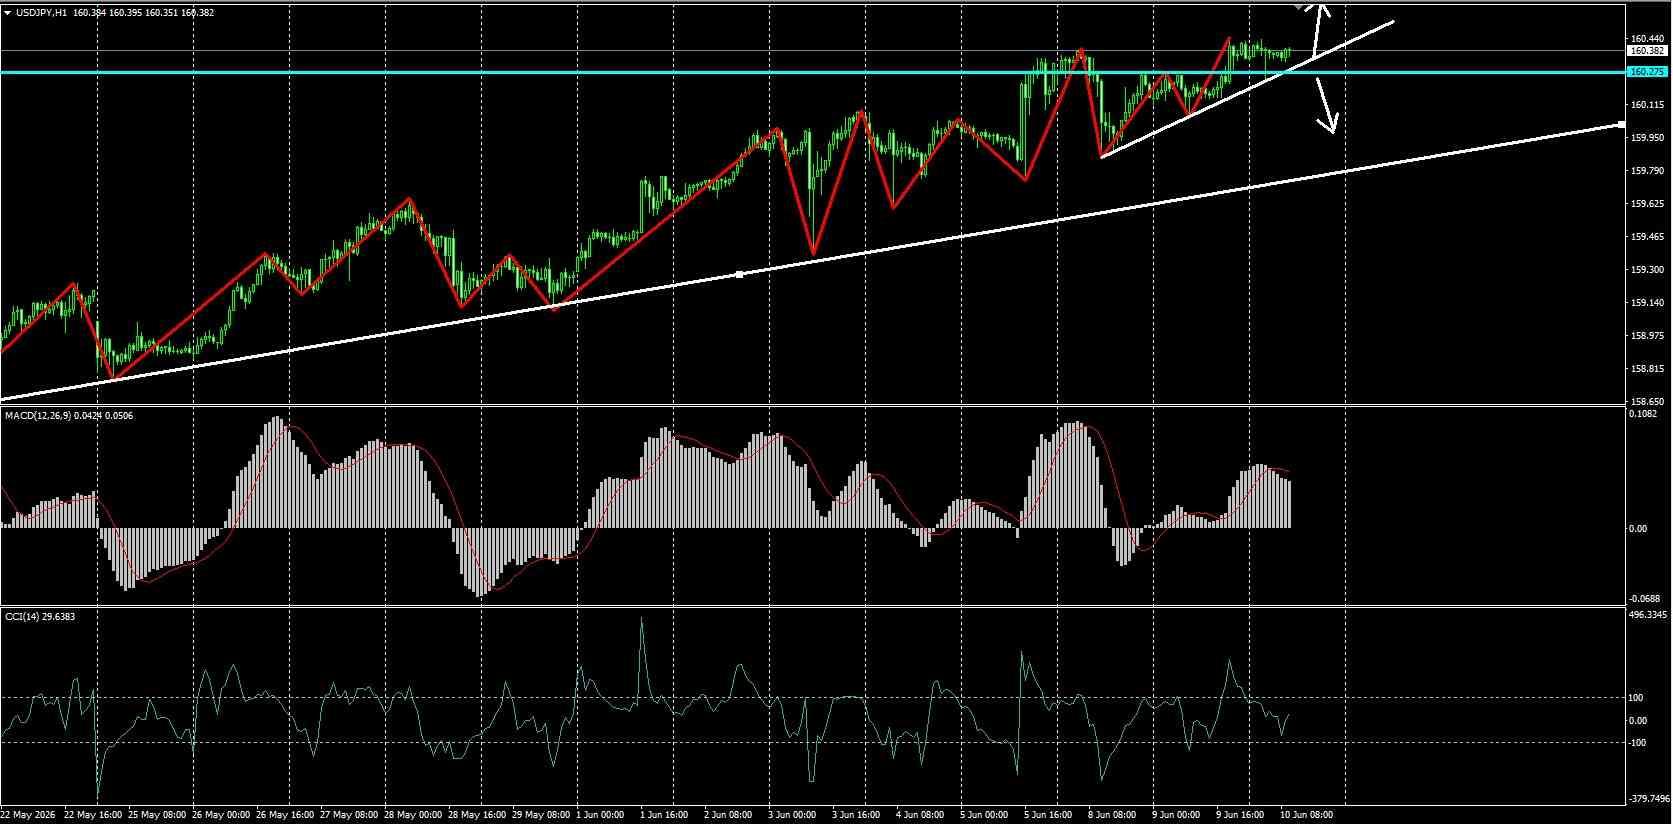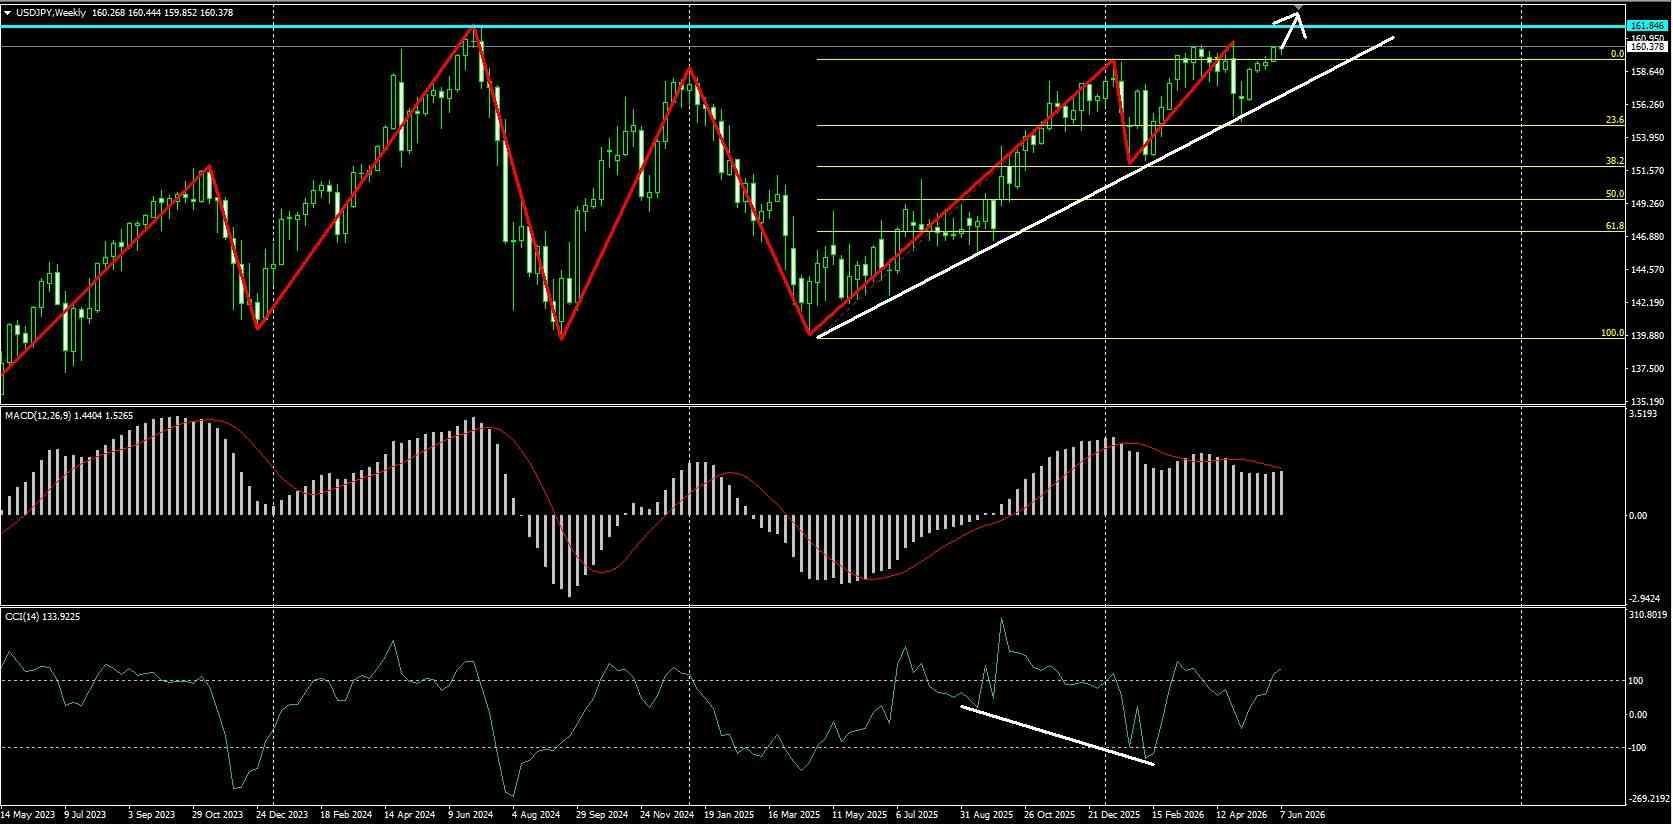
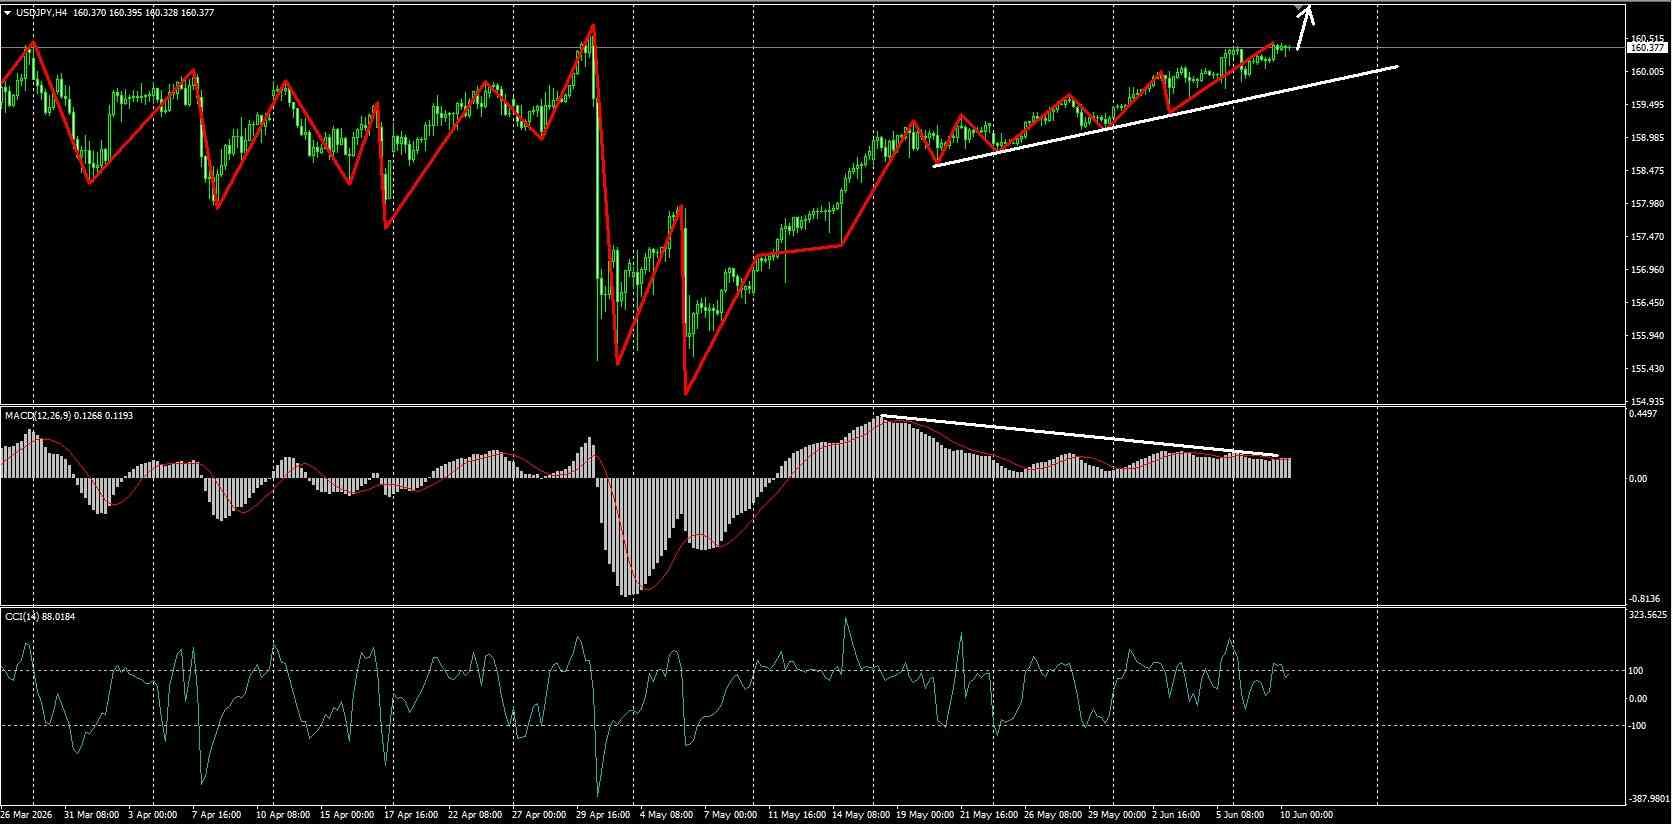
Currency pair USDJPY chart W1. On the weekly timeframe, the wave structure is forming an upward trend, with the MACD indicator in the overbought zone. I still expect the price to aim for a retest of the 2024 high, entering above the 161.85 level. However, this move was not successful, as a pullback occurred after a slight retest of the 2025 high. The pullback retraced to the 38.2 level on the Fibonacci correction grid applied to the growth. There was a signal for an upward movement from the CCI indicator - a bullish convergence that worked well. We retested this year's high, and there is little doubt that the price will continue towards the indicated high. Although there is a bearish divergence on the MACD indicator. During this signal, there was a slight pullback and some development, which was limited by the ascending support line. Enough sellers accumulated, the decline stopped, and the uptrend resumed, heading towards the 2024 high. The 2024 high is not only the high of that year but also a historical high in the entire history that can be seen on the terminal. It is possible to consider working downwards from there to attempt a correction. Other major pairs, such as the euro and the pound against the dollar, have already shown signs of weakness and are inclined to further decline. Therefore, here, as the opposing pair, further growth is expected. Until the price breaks above the high on smaller timeframes, only bullish formations are considered. Anything for sale, even the most attractive for sale, should be skipped until the peak is updated. It is said that Japan does not need to weaken its currency at all, and they are preparing to resist if the weakening trend continues. In the second half of last May, the price did not move very actively, unlike the first half of May. But everything remains as it was before, with a tendency towards further growth. On Friday, June 5th, there were important news, the so-called Non-Farm Payrolls, employment data in the USA. The indicators came out better than expected, as a result, the US dollar strengthened overall in the market. Chart H4. The wave structure is forming an upward trend, with the MACD indicator in the overbought zone. Despite a very long bearish divergence on this indicator, the price is moving up, and until it breaks above the designated targets, there is no need to expect a reversal. In today's economic calendar, at 15:30 - the Consumer Price Index in the USA. On the hourly chart, I see resistance at the ascending line and the support level of 160.27. If anyone wants to go short, they need to at least break through the line and the level. Then they will likely target the higher ascending line.