Main Quotes Calendar Forum
flag

FX.co ★ CL/Crude Oil

back
Trader Journals:::2026-11-15T05:00:41

CL/Crude Oil

Unraveling Bearish Pressure on Crude Oil: Daily Chart Evaluation of Crude Light Sweet Oil (#CL)

CL/Crude Oil

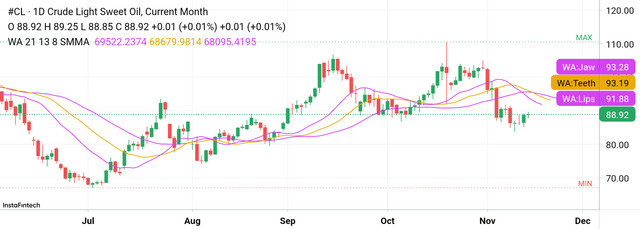
The dynamics of the global energy market once again present fairly sharp price movements to observe, particularly in the crude oil futures contract Crude Light Sweet Oil (#CL). Based on the daily chart (1D) from the InstaFintech platform, this commodity’s movement shows a fairly deep corrective phase after previously reaching the highest level area at elevated prices. Let's examine in depth the strength map of the price action and the readings of trend indicators accompanying the current price movement, without using stiff language. 1. Examining the Track Record of Movement and Price Action (Price Action) Climb Phase and Highest Peak: Starting from mid-year into October, the crude oil market recorded a very aggressive strengthening trend. Prices shot up gradually from the lower base area around the 70.00 level and continued to climb until they managed to break the psychological barrier above 105.00 approaching the end of October. Drastic Fall Piercing Key Levels: However, that rising momentum suddenly stalled when selling pressure massively dominated the market. Sharp declines occurred consecutively, where rows of large red candles plunged through various important support boundaries in a relatively short time. Current Market Position: Currently, the trading price is observed at level 88.92, with opening price (open) at 88.92, daily high (high) at 89.25, low (low) at 88.85, and recording a slight daily change of +0.01 (+0.01%). The price appears to be attempting to build a stable footing after the fall it experienced. 2. Reading the Williams Alligator Indicator Signals (WA 21 13 8 SMMA) On this daily chart panel, there is a trend indicator device based on the Smoothed Moving Average popularly known as the Williams Alligator, using key parameters (21, 13, 8): WA:Lips (Lower Purple Line at level 91.88): This fastest short-term trend line component is now positioned just above the current running price, indicating that short-term control is still held by sellers. WA:Teeth (Yellow Line at level 93.19): Acts as the medium balance line. Its position above the Lips line reinforces that the medium-term trend structure is in a corrective phase. WA:Jaw (Upper Purple Line at level 93.28): Functions as the benchmark for the long-term macro trend. The Alligator lines closing in and positioned above the running price confirm that bearish dominance still looms over the commodity’s range. 3. Considering the Market Direction Projection Ahead Given the price's position being held below the 89.00 range and below all layers of the Alligator indicator lines, the market faces several possible scenarios: Continued Pressure Scenario (Bearish Pressure): If sellers again take advantage of the momentum to push prices down, there is room for weakness to retest lower psychological support areas below the current level. Consolidation and Recovery Scenario (Recovery Attempt): On the other hand, if the area around the 88.00–89.00 level succeeds in acting as a strong defensive floor, the #CL commodity has the potential to make a slow pullback movement to approach the Lips line area around 91.88.
photo
Forum user
Share this article:
back
loader...
all-was_read__icon
You have watched all the best publications
presently.
We are already looking for something interesting for you...
all-was_read__star
Recently published:
loader...
More recent publications...