


FX.co ★ Actual patterns. Technical analysis and trading recommendations
Actual patterns

Head and Shoulders

The technical pattern called Head and Shoulders has appeared on the chart of USDCHF M5. There are weighty reasons to suggest that the price will surpass the Neckline 0.8099/0.8100 after the right shoulder has been formed. So, the trend is set to change with the price heading for 0.8085.
Triple Top

On the chart of the USDCHF M15 trading instrument, the Triple Top pattern that signals a trend change has formed. It is possible that after formation of the third peak, the price will try to break through the resistance level 0.8096, where we advise to open a trading position for sale. Take profit is the projection of the pattern’s width, which is 10 points.
Inverse Head and Shoulder

According to M5, USDCHF is shaping the technical pattern – the Inverse Head and Shoulder. In case the Neckline 0.8076/0.8075 is broken out, the instrument is likely to move toward 0.8090.
Inverse Head and Shoulder
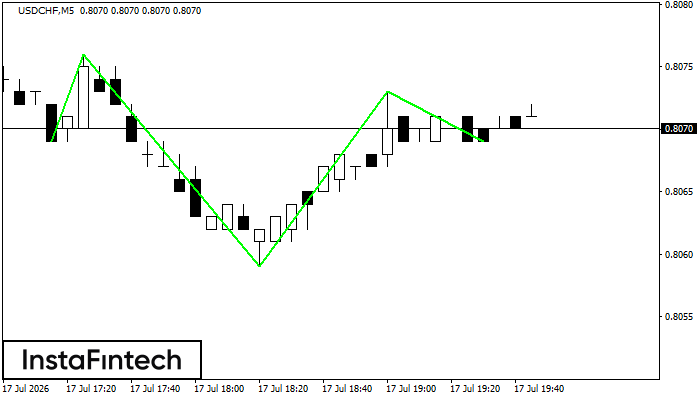
According to M5, USDCHF is shaping the technical pattern – the Inverse Head and Shoulder. In case the Neckline 0.8076/0.8073 is broken out, the instrument is likely to move toward 0.8088.
Inverse Head and Shoulder
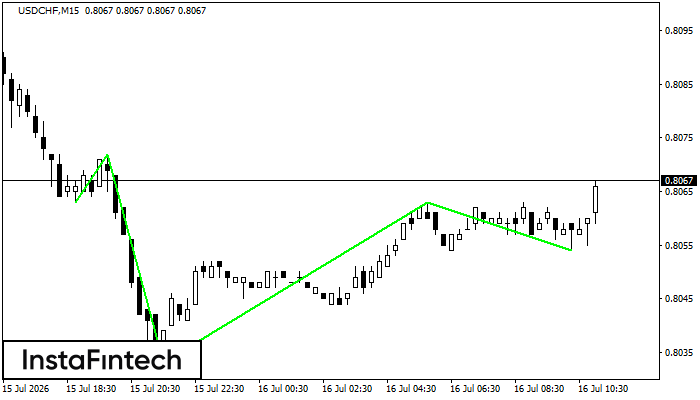
According to the chart of M15, USDCHF produced the pattern termed the Inverse Head and Shoulder. The Head is fixed at 0.8033 while the median line of the Neck is set at 0.8072/0.8063. The formation of the Inverse Head and Shoulder Pattern clearly indicates a reversal of the downward trend. In means that in case the scenario comes true, the price of USDCHF will go towards 0.8086.


