


FX.co ★ Actual patterns. Technical analysis and trading recommendations
Actual patterns

Triple Top

On the chart of the USDJPY M5 trading instrument, the Triple Top pattern that signals a trend change has formed. It is possible that after formation of the third peak, the price will try to break through the resistance level 162.52, where we advise to open a trading position for sale. Take profit is the projection of the pattern’s width, which is 8 points.
Bullish Rectangle

According to the chart of M5, USDJPY formed the Bullish Rectangle. This type of a pattern indicates a trend continuation. It consists of two levels: resistance 162.44 and support 162.40. In case the resistance level 162.44 - 162.44 is broken, the instrument is likely to follow the bullish trend.
REGISTER
on the forum for traders
AND EARN MONEY!
Register nowon the forum for traders
AND EARN MONEY!
Bearish Symmetrical Triangle

According to the chart of M5, USDJPY formed the Bearish Symmetrical Triangle pattern. Description: The lower border is 162.32/162.37 and upper border is 162.43/162.37. The pattern width is measured on the chart at -11 pips. The formation of the Bearish Symmetrical Triangle pattern evidently signals a continuation of the downward trend. In other words, if the scenario comes true and USDJPY breaches the lower border, the price could continue its move toward 162.22.
Double Top
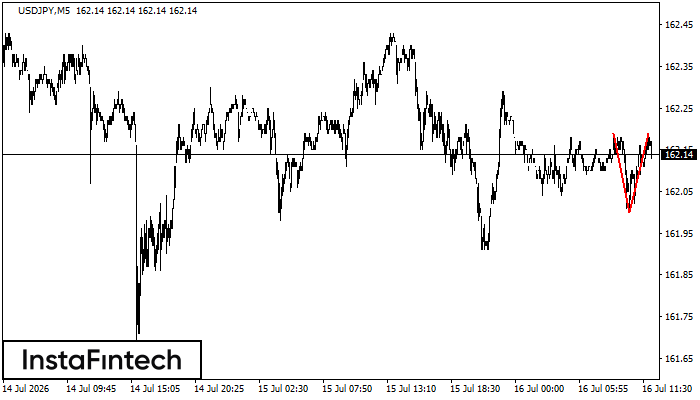
On the chart of USDJPY M5 the Double Top reversal pattern has been formed. Characteristics: the upper boundary 162.19; the lower boundary 162.00; the width of the pattern 19 points. The signal: a break of the lower boundary will cause continuation of the downward trend targeting the 161.85 level.
Bullish Symmetrical Triangle
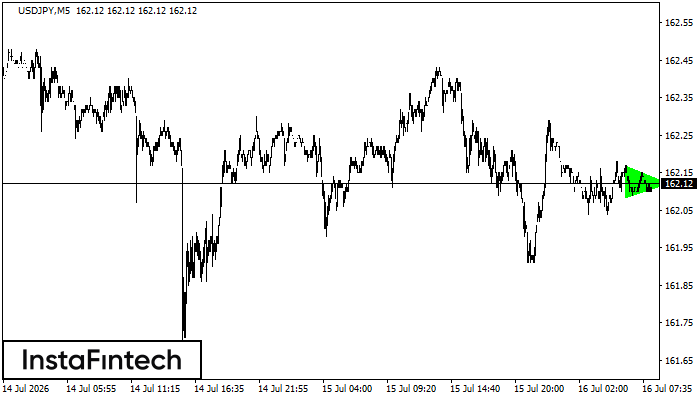
According to the chart of M5, USDJPY formed the Bullish Symmetrical Triangle pattern, which signals the trend will continue. Description. The upper border of the pattern touches the coordinates 162.17/162.12 whereas the lower border goes across 162.09/162.12. The pattern width is measured on the chart at 8 pips. If the Bullish Symmetrical Triangle pattern is in progress during the upward trend, this indicates the current trend will go on. In case 162.12 is broken, the price could continue its move toward 162.27.


