


FX.co ★ Actual patterns. Technical analysis and trading recommendations
Actual patterns

Bearish Symmetrical Triangle
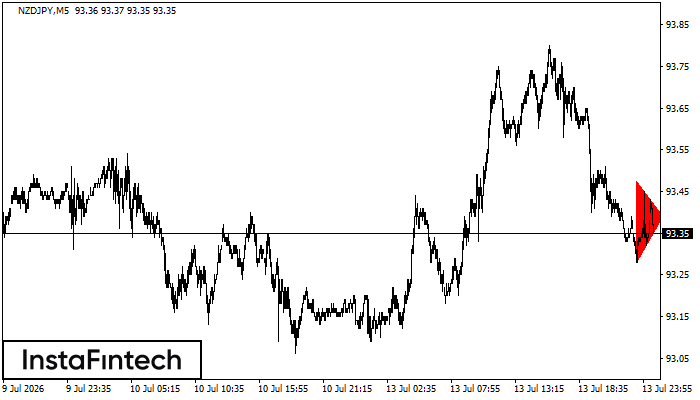
According to the chart of M5, NZDJPY formed the Bearish Symmetrical Triangle pattern. This pattern signals a further downward trend in case the lower border 93.28 is breached. Here, a hypothetical profit will equal the width of the available pattern that is -20 pips.
Double Top
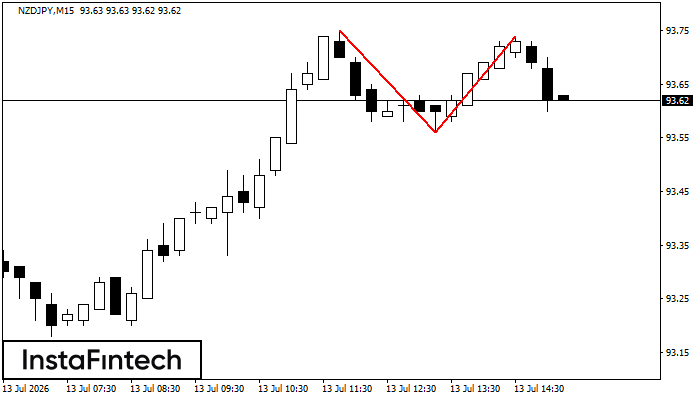
On the chart of NZDJPY M15 the Double Top reversal pattern has been formed. Characteristics: the upper boundary 93.74; the lower boundary 93.56; the width of the pattern 18 points. The signal: a break of the lower boundary will cause continuation of the downward trend targeting the 93.33 level.
Double Bottom
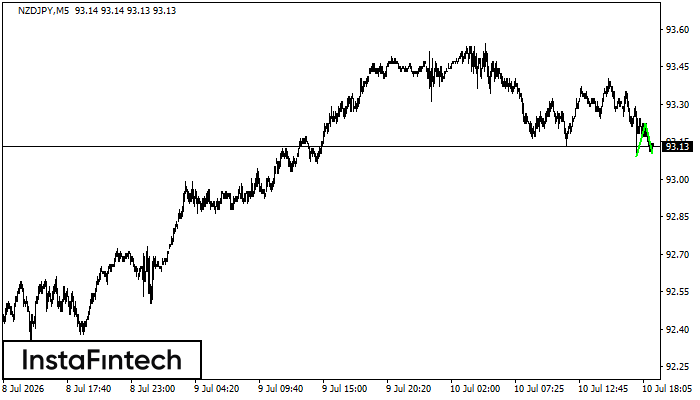
The Double Bottom pattern has been formed on NZDJPY M5. Characteristics: the support level 93.09; the resistance level 93.22; the width of the pattern 13 points. If the resistance level is broken, a change in the trend can be predicted with the first target point lying at the distance of 12 points.
Double Top
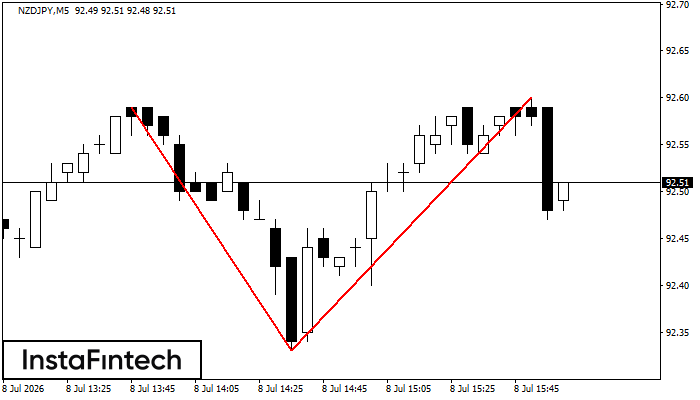
On the chart of NZDJPY M5 the Double Top reversal pattern has been formed. Characteristics: the upper boundary 92.60; the lower boundary 92.33; the width of the pattern 27 points. The signal: a break of the lower boundary will cause continuation of the downward trend targeting the 92.18 level.
Bearish Rectangle
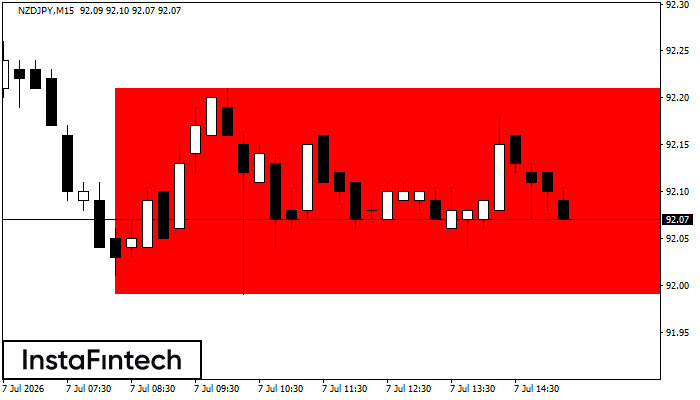
According to the chart of M15, NZDJPY formed the Bearish Rectangle. This type of a pattern indicates a trend continuation. It consists of two levels: resistance 92.21 - 0.00 and support 91.99 – 91.99. In case the resistance level 91.99 - 91.99 is broken, the instrument is likely to follow the bearish trend.


