


FX.co ★ Actual patterns. Technical analysis and trading recommendations
Actual patterns

Double Top

The Double Top reversal pattern has been formed on AUDCHF M30. Characteristics: the upper boundary 0.5690; the lower boundary 0.5684; the width of the pattern is 6 points. Sell trades are better to be opened below the lower boundary 0.5684 with a possible movements towards the 0.5654 level.
Double Top

On the chart of AUDCHF M15 the Double Top reversal pattern has been formed. Characteristics: the upper boundary 0.5690; the lower boundary 0.5684; the width of the pattern 6 points. The signal: a break of the lower boundary will cause continuation of the downward trend targeting the 0.5662 level.
Double Top

The Double Top pattern has been formed on AUDCHF M5. It signals that the trend has been changed from upwards to downwards. Probably, if the base of the pattern 0.5643 is broken, the downward movement will continue.
Bullish Symmetrical Triangle
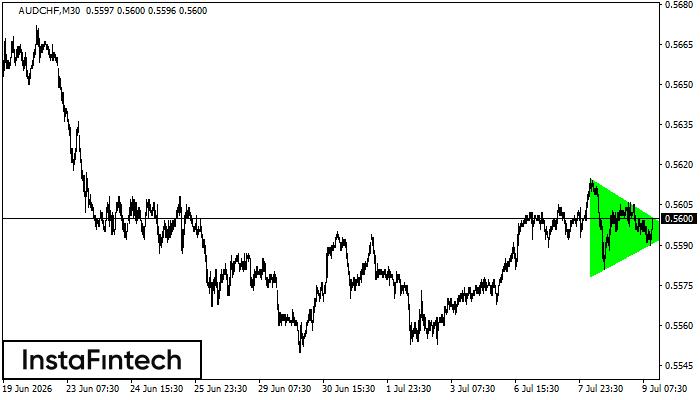
According to the chart of M30, AUDCHF formed the Bullish Symmetrical Triangle pattern. The lower border of the pattern touches the coordinates 0.5578/0.5595 whereas the upper border goes across 0.5615/0.5595. If the Bullish Symmetrical Triangle pattern is in progress, this evidently signals a further upward trend. In other words, in case the scenario comes true, the price of AUDCHF will breach the upper border to head for 0.5625.
Double Bottom
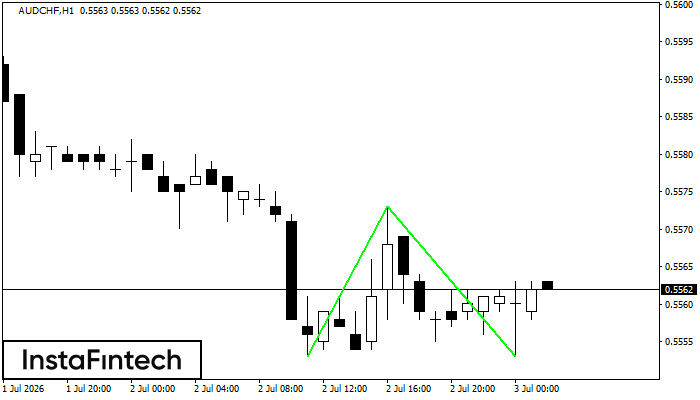
The Double Bottom pattern has been formed on AUDCHF H1. Characteristics: the support level 0.5553; the resistance level 0.5573; the width of the pattern 20 points. If the resistance level is broken, a change in the trend can be predicted with the first target point lying at the distance of 20 points.


