


FX.co ★ Actual patterns. Technical analysis and trading recommendations
Actual patterns

Double Bottom

The Double Bottom pattern has been formed on AUDJPY M5. Characteristics: the support level 114.13; the resistance level 114.17; the width of the pattern 4 points. If the resistance level is broken, a change in the trend can be predicted with the first target point lying at the distance of 4 points.
Double Top

The Double Top pattern has been formed on AUDJPY M15. It signals that the trend has been changed from upwards to downwards. Probably, if the base of the pattern 113.96 is broken, the downward movement will continue.
Bearish pennant

The Bearish pennant pattern has formed on the AUDJPY M5 chart. It signals potential continuation of the existing trend. Specifications: the pattern’s bottom has the coordinate of 113.06; the projection of the flagpole height is equal to 28 pips. In case the price breaks out the pattern’s bottom of 113.06, the downtrend is expected to continue for further level 112.91.
Double Bottom

The Double Bottom pattern has been formed on AUDJPY M5. This formation signals a reversal of the trend from downwards to upwards. The signal is that a buy trade should be opened after the upper boundary of the pattern 113.31 is broken. The further movements will rely on the width of the current pattern 9 points.
Triple Top
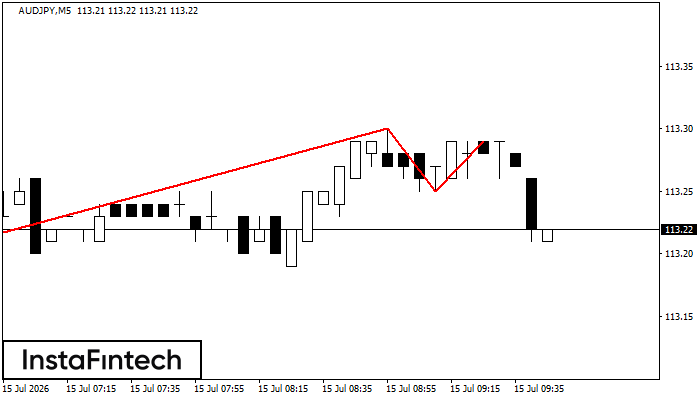
On the chart of the AUDJPY M5 trading instrument, the Triple Top pattern that signals a trend change has formed. It is possible that after formation of the third peak, the price will try to break through the resistance level 113.20, where we advise to open a trading position for sale. Take profit is the projection of the pattern’s width, which is 8 points.


