


FX.co ★ Actual patterns. Technical analysis and trading recommendations
Actual patterns

Bearish Symmetrical Triangle

According to the chart of M5, GBPCHF formed the Bearish Symmetrical Triangle pattern. Trading recommendations: A breach of the lower border 1.0838 is likely to encourage a continuation of the downward trend.
Double Top
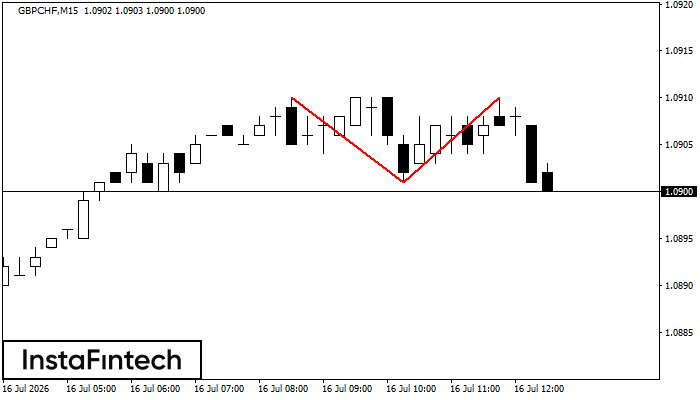
The Double Top pattern has been formed on GBPCHF M15. It signals that the trend has been changed from upwards to downwards. Probably, if the base of the pattern 1.0901 is broken, the downward movement will continue.
REGISTER
on the forum for traders
AND EARN MONEY!
Register nowon the forum for traders
AND EARN MONEY!
Bearish Rectangle
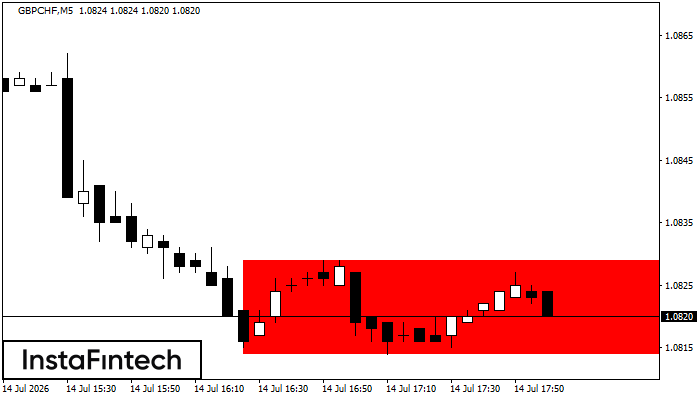
According to the chart of M5, GBPCHF formed the Bearish Rectangle. This type of a pattern indicates a trend continuation. It consists of two levels: resistance 1.0829 - 0.0000 and support 1.0814 – 1.0814. In case the resistance level 1.0814 - 1.0814 is broken, the instrument is likely to follow the bearish trend.
Double Bottom
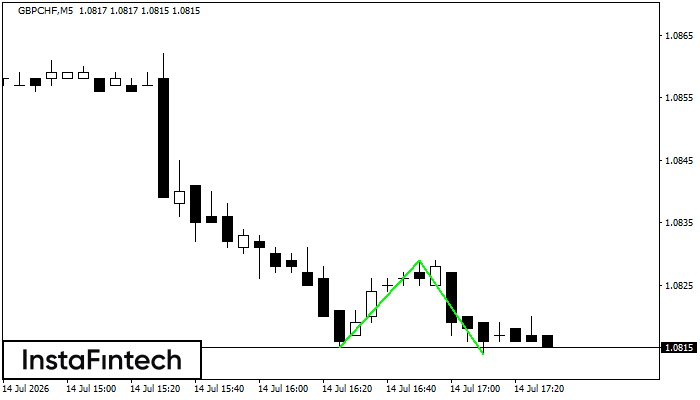
The Double Bottom pattern has been formed on GBPCHF M5. Characteristics: the support level 1.0815; the resistance level 1.0829; the width of the pattern 14 points. If the resistance level is broken, a change in the trend can be predicted with the first target point lying at the distance of 15 points.
Bullish Symmetrical Triangle
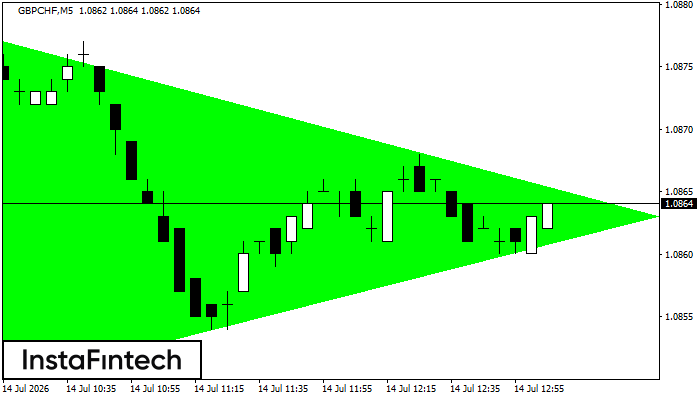
According to the chart of M5, GBPCHF formed the Bullish Symmetrical Triangle pattern, which signals the trend will continue. Description. The upper border of the pattern touches the coordinates 1.0878/1.0863 whereas the lower border goes across 1.0849/1.0863. The pattern width is measured on the chart at 29 pips. If the Bullish Symmetrical Triangle pattern is in progress during the upward trend, this indicates the current trend will go on. In case 1.0863 is broken, the price could continue its move toward 1.0878.


