


FX.co ★ Actual patterns. Technical analysis and trading recommendations
Actual patterns

Bearish pennant

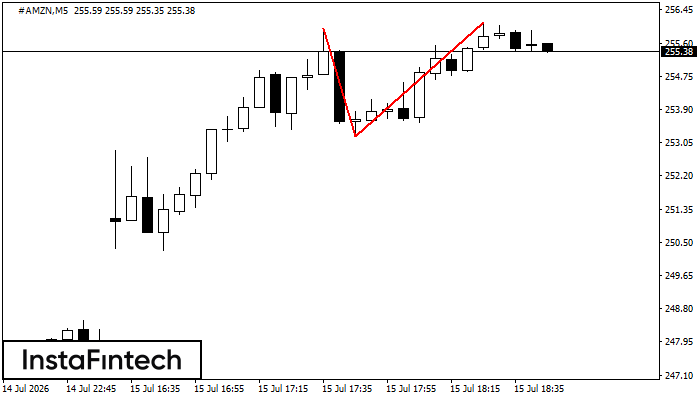
The Bearish pennant pattern has formed on the #AMZN M5 chart. It signals potential continuation of the existing trend. Specifications: the pattern’s bottom has the coordinate of 246.63; the projection of the flagpole height is equal to 347 pips. In case the price breaks out the pattern’s bottom of 246.63, the downtrend is expected to continue for further level 246.48.
Bullish Rectangle
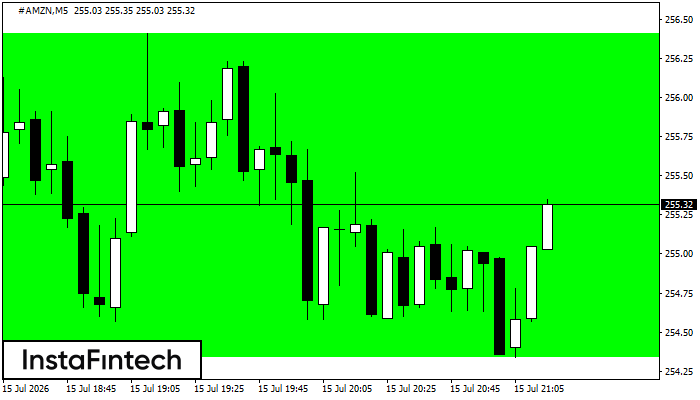
According to the chart of M5, #AMZN formed the Bullish Rectangle. This type of a pattern indicates a trend continuation. It consists of two levels: resistance 256.41 and support 254.34. In case the resistance level 256.41 - 256.41 is broken, the instrument is likely to follow the bullish trend.
Double Top
On the chart of #AMZN M5 the Double Top reversal pattern has been formed. Characteristics: the upper boundary 256.13; the lower boundary 253.21; the width of the pattern 292 points. The signal: a break of the lower boundary will cause continuation of the downward trend targeting the 253.06 level.
Double Bottom
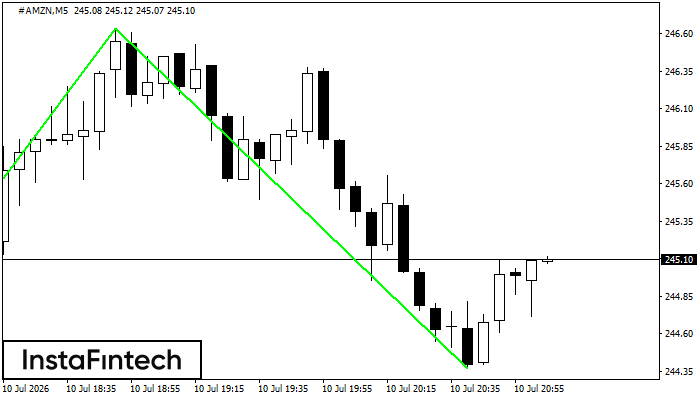
The Double Bottom pattern has been formed on #AMZN M5; the upper boundary is 246.64; the lower boundary is 244.37. The width of the pattern is 228 points. In case of a break of the upper boundary 246.64, a change in the trend can be predicted where the width of the pattern will coincide with the distance to a possible take profit level.
Triple Top
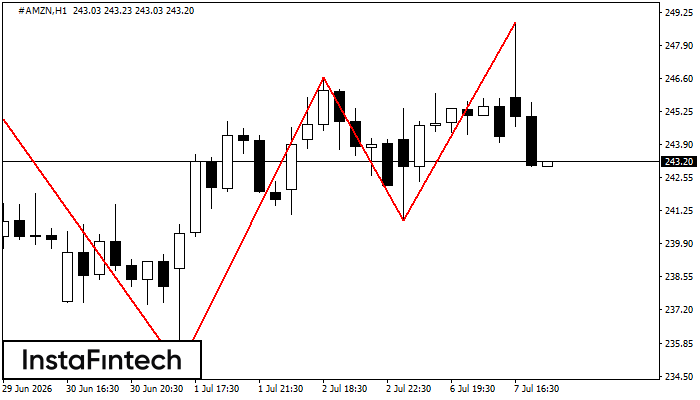
On the chart of the #AMZN H1 trading instrument, the Triple Top pattern that signals a trend change has formed. It is possible that after formation of the third peak, the price will try to break through the resistance level 234.85, where we advise to open a trading position for sale. Take profit is the projection of the pattern’s width, which is 1185 points.


