


FX.co ★ Actual patterns. Technical analysis and trading recommendations
Actual patterns

Double Bottom
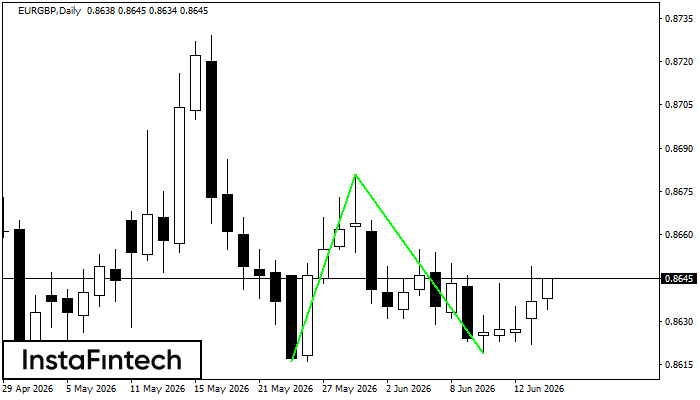
The Double Bottom pattern has been formed on EURGBP D1. Characteristics: the support level 0.8616; the resistance level 0.8681; the width of the pattern 65 points. If the resistance level is broken, a change in the trend can be predicted with the first target point lying at the distance of 62 points.
Double Bottom
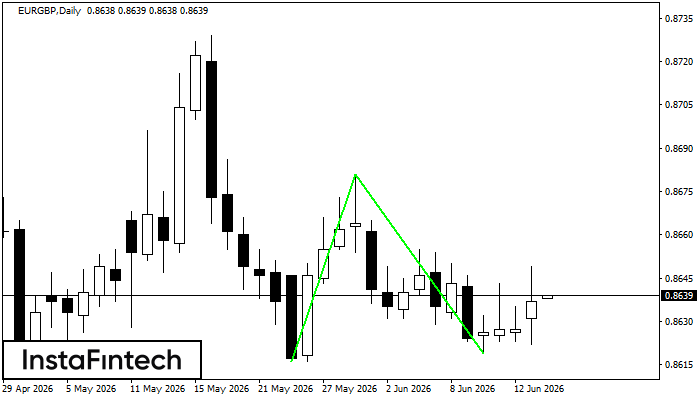
The Double Bottom pattern has been formed on EURGBP D1; the upper boundary is 0.8681; the lower boundary is 0.8619. The width of the pattern is 65 points. In case of a break of the upper boundary 0.8681, a change in the trend can be predicted where the width of the pattern will coincide with the distance to a possible take profit level.
Bearish Rectangle
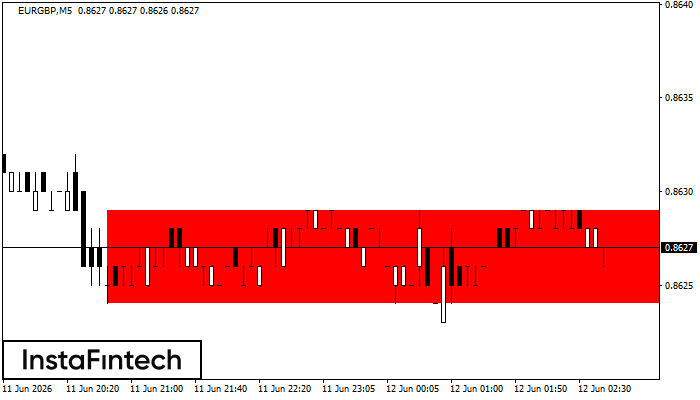
According to the chart of M5, EURGBP formed the Bearish Rectangle which is a pattern of a trend continuation. The pattern is contained within the following borders: lower border 0.8624 – 0.8624 and upper border 0.8629 – 0.8629. In case the lower border is broken, the instrument is likely to follow the downward trend.
Double Bottom
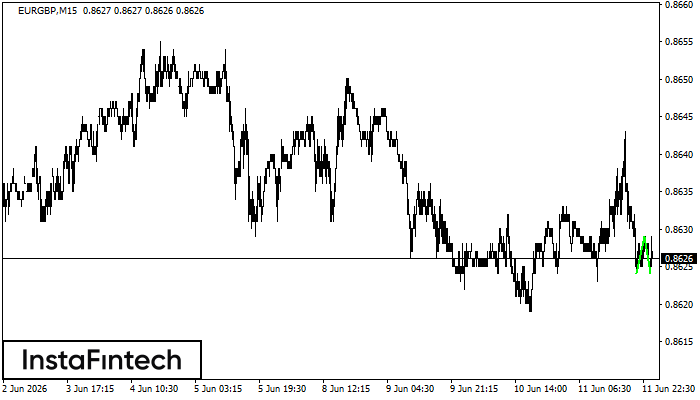
The Double Bottom pattern has been formed on EURGBP M15. This formation signals a reversal of the trend from downwards to upwards. The signal is that a buy trade should be opened after the upper boundary of the pattern 0.8629 is broken. The further movements will rely on the width of the current pattern 5 points.
Inverse Head and Shoulder
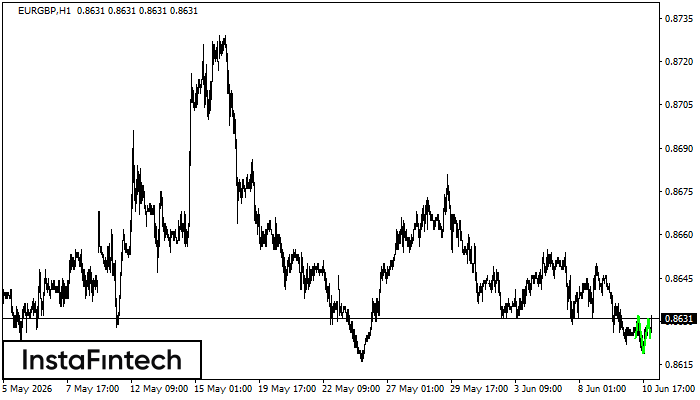
According to H1, EURGBP is shaping the technical pattern – the Inverse Head and Shoulder. In case the Neckline 0.8632/0.8631 is broken out, the instrument is likely to move toward 0.8671.


