


FX.co ★ Actual patterns. Technical analysis and trading recommendations
Actual patterns

Double Top

The Double Top pattern has been formed on #KO M5. It signals that the trend has been changed from upwards to downwards. Probably, if the base of the pattern 81.31 is broken, the downward movement will continue.
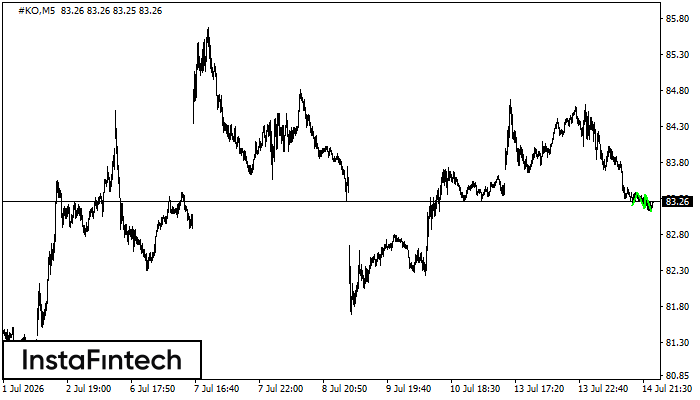
Double Bottom

The Double Bottom pattern has been formed on #KO M5. This formation signals a reversal of the trend from downwards to upwards. The signal is that a buy trade should be opened after the upper boundary of the pattern 82.35 is broken. The further movements will rely on the width of the current pattern 103 points.
Bearish pennant
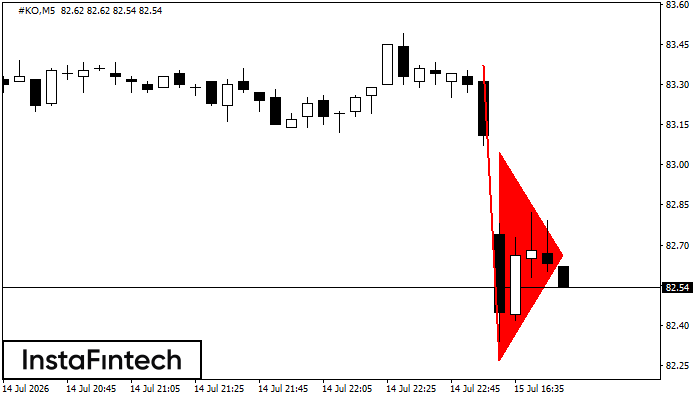
The Bearish pennant pattern has formed on the #KO M5 chart. The pattern signals continuation of the downtrend in case the pennant’s low of 82.27 is broken through. Recommendations: Place the sell stop pending order 10 pips below the pattern’s low. Place the take profit order at the projection distance of the flagpole height.
Triple Bottom
The Triple Bottom pattern has formed on the chart of #KO M5. Features of the pattern: The lower line of the pattern has coordinates 83.38 with the upper limit 83.38/83.36, the projection of the width is 18 points. The formation of the Triple Bottom pattern most likely indicates a change in the trend from downward to upward. This means that in the event of a breakdown of the resistance level 83.20, the price is most likely to continue the upward movement.
Triple Top
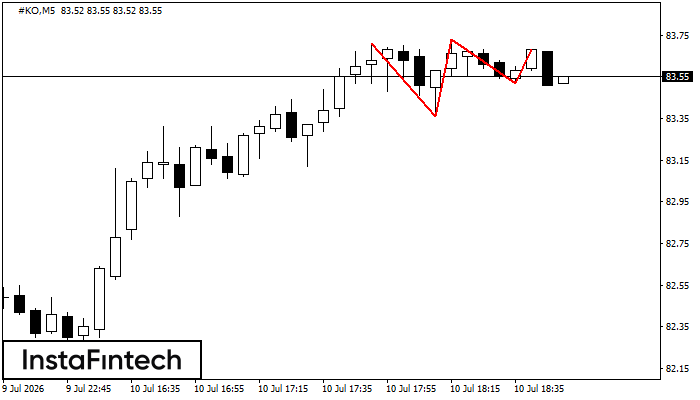
On the chart of the #KO M5 trading instrument, the Triple Top pattern that signals a trend change has formed. It is possible that after formation of the third peak, the price will try to break through the resistance level 83.36, where we advise to open a trading position for sale. Take profit is the projection of the pattern’s width, which is 35 points.


