


FX.co ★ Actual patterns. Technical analysis and trading recommendations
Actual patterns

Double Bottom
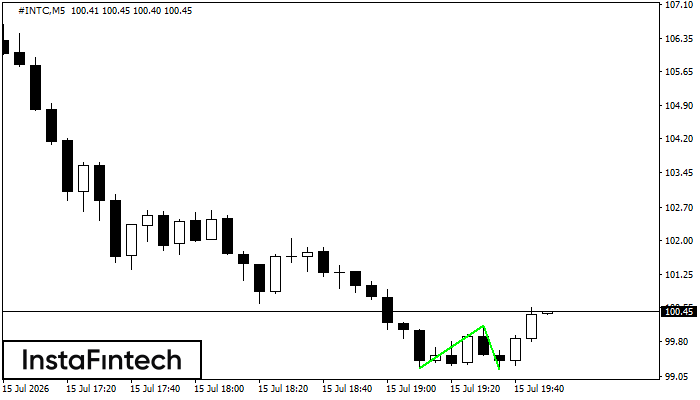
The Double Bottom pattern has been formed on #INTC M5. This formation signals a reversal of the trend from downwards to upwards. The signal is that a buy trade should be opened after the upper boundary of the pattern 100.15 is broken. The further movements will rely on the width of the current pattern 92 points.
Double Top
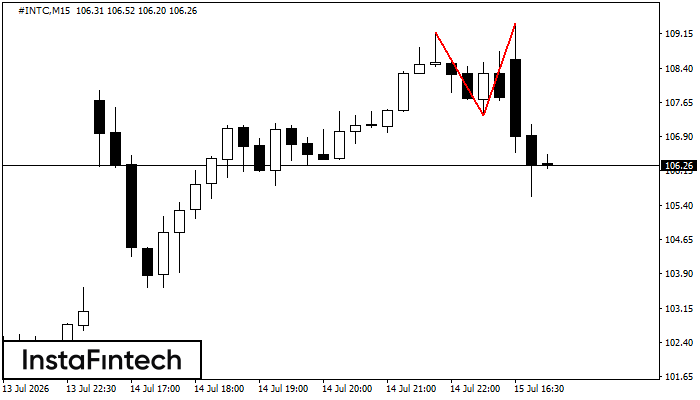
The Double Top pattern has been formed on #INTC M15. It signals that the trend has been changed from upwards to downwards. Probably, if the base of the pattern 107.36 is broken, the downward movement will continue.
Bearish pennant
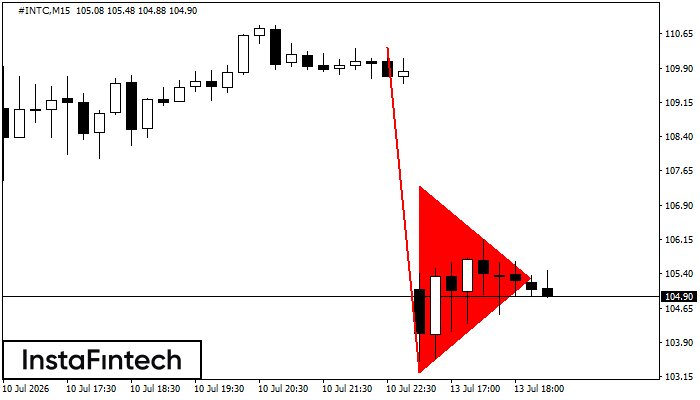
The Bearish pennant pattern has formed on the #INTC M15 chart. It signals potential continuation of the existing trend. Specifications: the pattern’s bottom has the coordinate of 103.25; the projection of the flagpole height is equal to 709 pips. In case the price breaks out the pattern’s bottom of 103.25, the downtrend is expected to continue for further level 103.03.
Bearish pennant
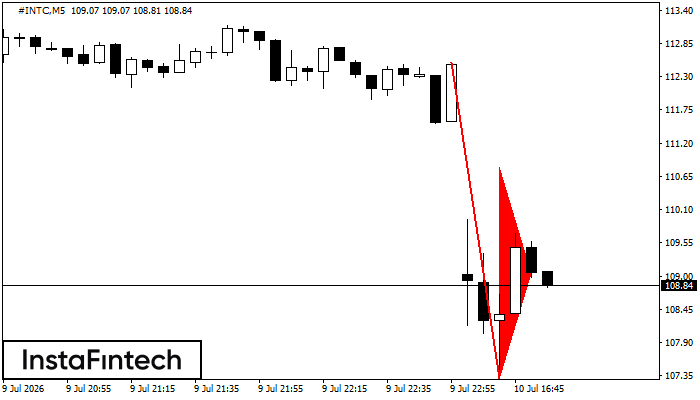
The Bearish pennant pattern has formed on the #INTC M5 chart. This pattern type is characterized by a slight slowdown after which the price will move in the direction of the original trend. In case the price fixes below the pattern’s low of 107.29, a trader will be able to successfully enter the sell position.
Bearish pennant
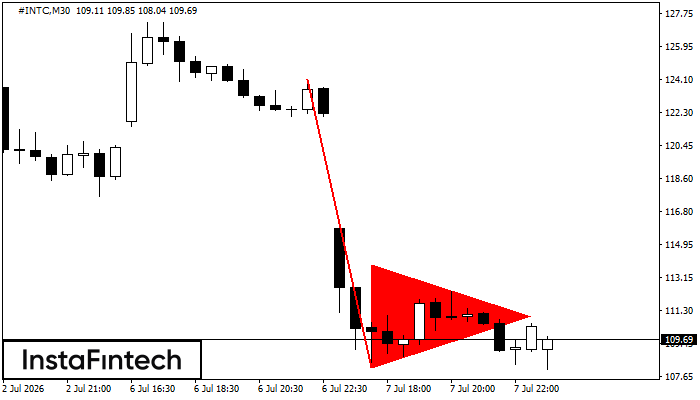
The Bearish pennant pattern has formed on the #INTC M30 chart. The pattern signals continuation of the downtrend in case the pennant’s low of 108.16 is broken through. Recommendations: Place the sell stop pending order 10 pips below the pattern’s low. Place the take profit order at the projection distance of the flagpole height.


