


FX.co ★ Actual patterns. Technical analysis and trading recommendations
Actual patterns

Triple Top

The Triple Top pattern has formed on the chart of the #MSFT M5. Features of the pattern: borders have an ascending angle; the lower line of the pattern has the coordinates 400.27/400.81 with the upper limit 403.09/402.34; the projection of the width is 282 points. The formation of the Triple Top figure most likely indicates a change in the trend from upward to downward. This means that in the event of a breakdown of the support level of 400.27, the price is most likely to continue the downward movement.
Bullish Symmetrical Triangle

According to the chart of M5, #MSFT formed the Bullish Symmetrical Triangle pattern. Description: This is the pattern of a trend continuation. 403.09 and 400.00 are the coordinates of the upper and lower borders respectively. The pattern width is measured on the chart at 309 pips. Outlook: If the upper border 403.09 is broken, the price is likely to continue its move by 401.71.
Inverse Head and Shoulder
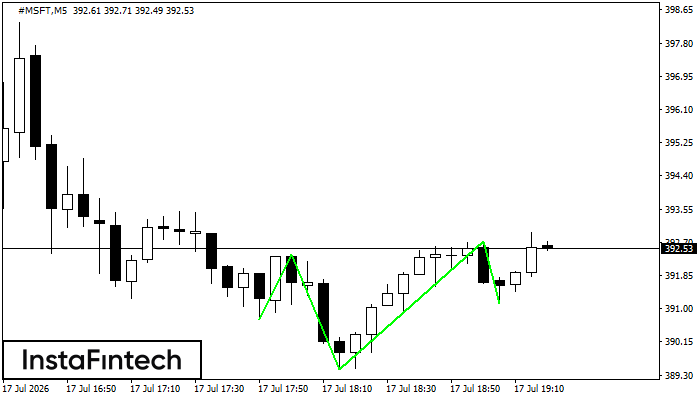
According to M5, #MSFT is shaping the technical pattern – the Inverse Head and Shoulder. In case the Neckline 392.38/392.71 is broken out, the instrument is likely to move toward 392.86.
Bullish Flag
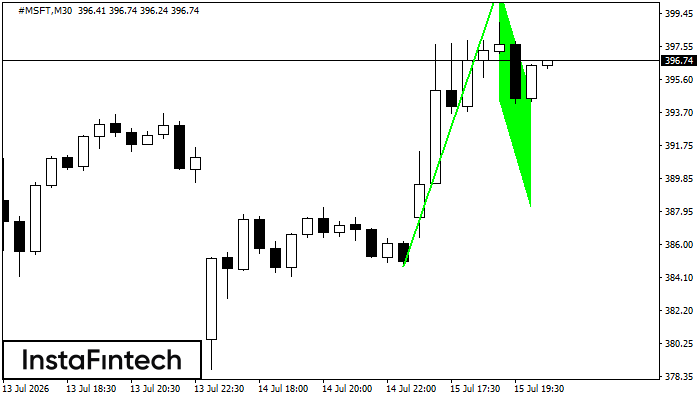
The Bullish Flag pattern has been formed on the chart #MSFT M30 which signals that the upward trend will continue. Signals: а break of the peak at 400.94 may push the price higher, and the rise will be the projection of the pole.
Bullish pennant
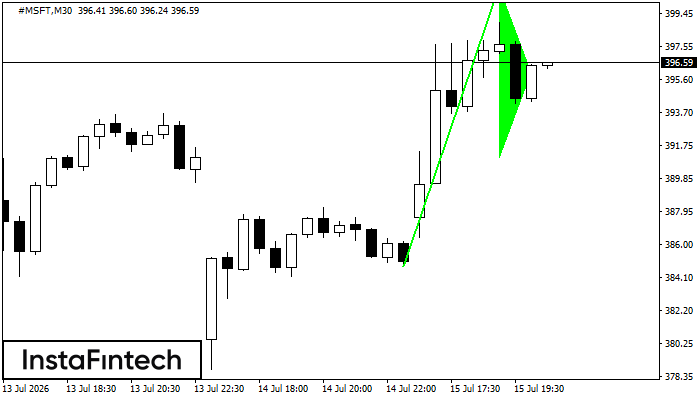
The Bullish pennant signal – Trading instrument #MSFT M30, continuation pattern. Forecast: it is possible to set up a buy position above the pattern’s high of 400.94, with the prospect of the next move being a projection of the flagpole height.


