


FX.co ★ Actual patterns. Technical analysis and trading recommendations
Actual patterns

Bearish Symmetrical Triangle

According to the chart of M15, #PEP formed the Bearish Symmetrical Triangle pattern. Trading recommendations: A breach of the lower border 133.94 is likely to encourage a continuation of the downward trend.
Inverse Head and Shoulder

According to the chart of M5, #PEP produced the pattern termed the Inverse Head and Shoulder. The Head is fixed at 133.94 while the median line of the Neck is set at 134.99/134.95. The formation of the Inverse Head and Shoulder Pattern clearly indicates a reversal of the downward trend. In means that in case the scenario comes true, the price of #PEP will go towards 135.10.
Double Bottom

The Double Bottom pattern has been formed on #PEP D1. Characteristics: the support level 134.92; the resistance level 149.02; the width of the pattern 1410 points. If the resistance level is broken, a change in the trend can be predicted with the first target point lying at the distance of 1432 points.
Double Bottom
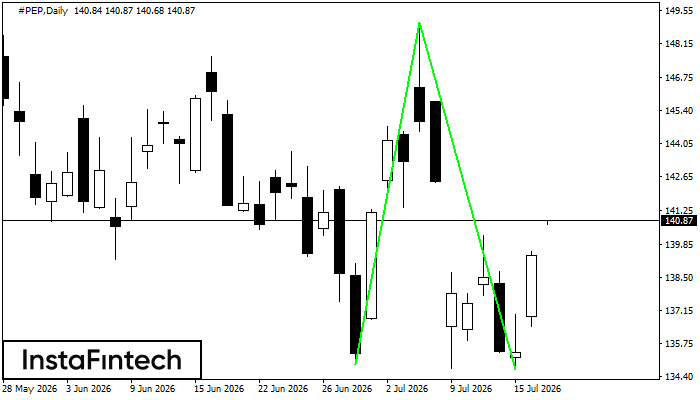
The Double Bottom pattern has been formed on #PEP D1. This formation signals a reversal of the trend from downwards to upwards. The signal is that a buy trade should be opened after the upper boundary of the pattern 149.02 is broken. The further movements will rely on the width of the current pattern 1410 points.
Bearish Symmetrical Triangle
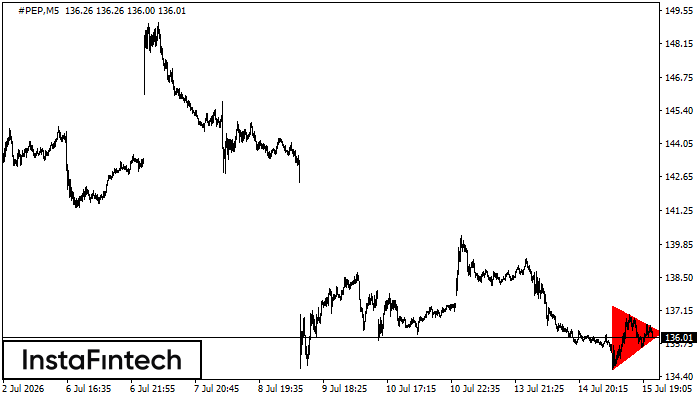
According to the chart of M5, #PEP formed the Bearish Symmetrical Triangle pattern. Trading recommendations: A breach of the lower border 134.70 is likely to encourage a continuation of the downward trend.


