


FX.co ★ Actual patterns. Technical analysis and trading recommendations
Actual patterns

Bearish Symmetrical Triangle

According to the chart of D1, #TSLA formed the Bearish Symmetrical Triangle pattern. This pattern signals a further downward trend in case the lower border 337.01 is breached. Here, a hypothetical profit will equal the width of the available pattern that is -13232 pips.
Double Bottom
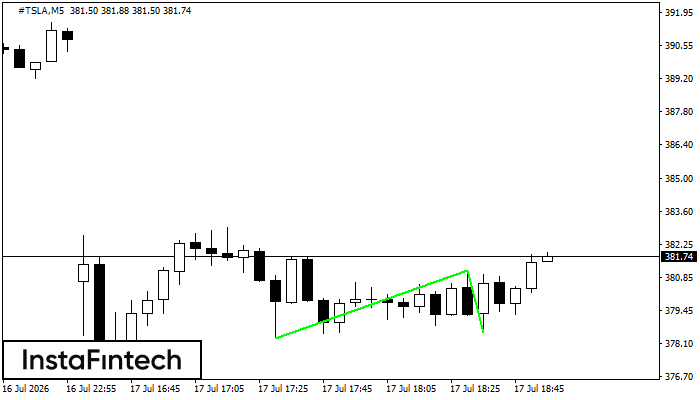
The Double Bottom pattern has been formed on #TSLA M5; the upper boundary is 381.15; the lower boundary is 378.56. The width of the pattern is 285 points. In case of a break of the upper boundary 381.15, a change in the trend can be predicted where the width of the pattern will coincide with the distance to a possible take profit level.
Bearish pennant
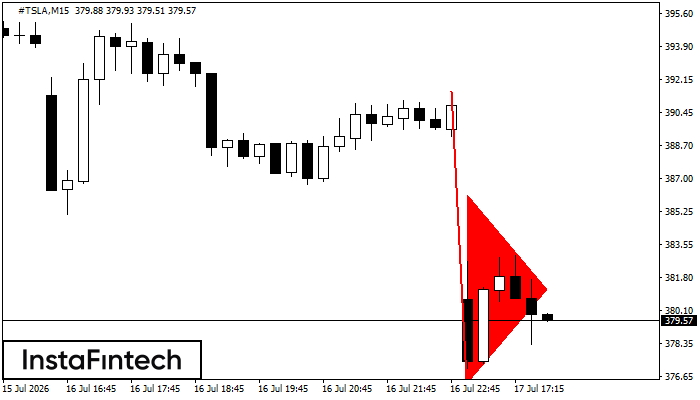
The Bearish pennant pattern has formed on the #TSLA M15 chart. The pattern signals continuation of the downtrend in case the pennant’s low of 376.24 is broken through. Recommendations: Place the sell stop pending order 10 pips below the pattern’s low. Place the take profit order at the projection distance of the flagpole height.
Bearish pennant
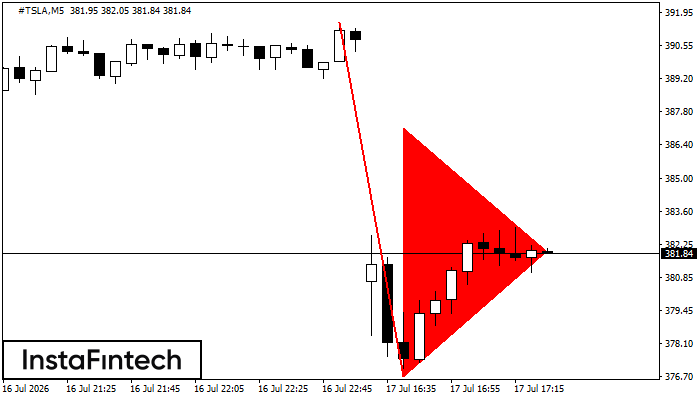
The Bearish pennant pattern has formed on the #TSLA M5 chart. The pattern signals continuation of the downtrend in case the pennant’s low of 376.70 is broken through. Recommendations: Place the sell stop pending order 10 pips below the pattern’s low. Place the take profit order at the projection distance of the flagpole height.
Bearish Symmetrical Triangle
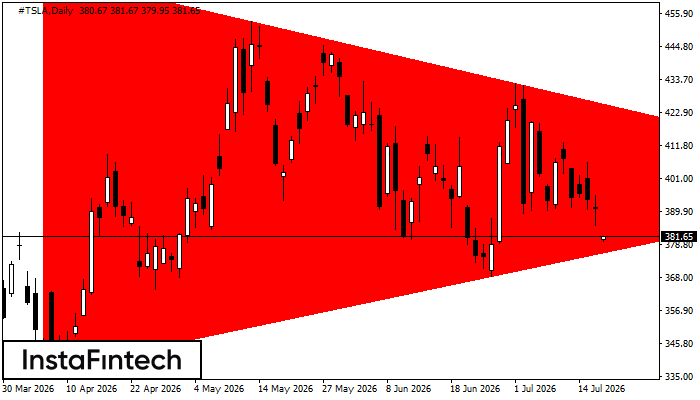
According to the chart of D1, #TSLA formed the Bearish Symmetrical Triangle pattern. Description: The lower border is 337.01/399.66 and upper border is 469.33/399.66. The pattern width is measured on the chart at -13232 pips. The formation of the Bearish Symmetrical Triangle pattern evidently signals a continuation of the downward trend. In other words, if the scenario comes true and #TSLA breaches the lower border, the price could continue its move toward 399.26.


