


USD/JPY is expected to trade with a bullish outlook. The pair is trading above its rising 50-period moving average, which plays a support role and maintains the bullish bias. The relative strength index lacks downward momentum. Even though a continuation of the consolidation cannot be ruled out, its extent should be limited.
The U.S. Commerce Department reported that personal income grew 0.2% on month in August (as expected) and personal spending was up 0.1% (as expected). Market News International posted its Chicago PMI at 65.2 in September (vs. 58.7 expected, 58.9 in August). And the University of Michigan posted its consumer sentiment index at 95.1 for September (vs, 95.3 previously estimated, 96.8 in August).
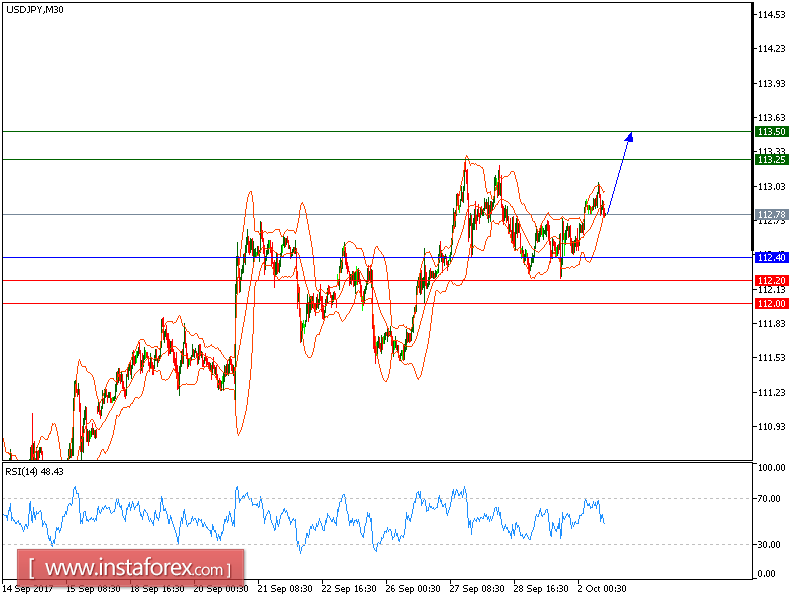
To sum up, as long as 112.40 holds on the downside, look for a further advance to 113.25 and even to 113.50 in extension.
Alternatively, if the price moves in the opposite direction, a short position is recommended below 112.40 with a target at 112.20.
Chart Explanation: The black line shows the pivot point. The current price above the pivot point indicates a bullish position, while the price below the pivot point is a signal for a short position. The red lines show the support levels and the green line indicates the resistance level. These levels can be used to enter and exit trades.
Strategy: BUY, Stop Loss: 112.40, Take Profit: 113.25
Resistance levels: 113.25, 113.50 and 114.00 Support Levels: 112.20, 112.00, 111.50


