


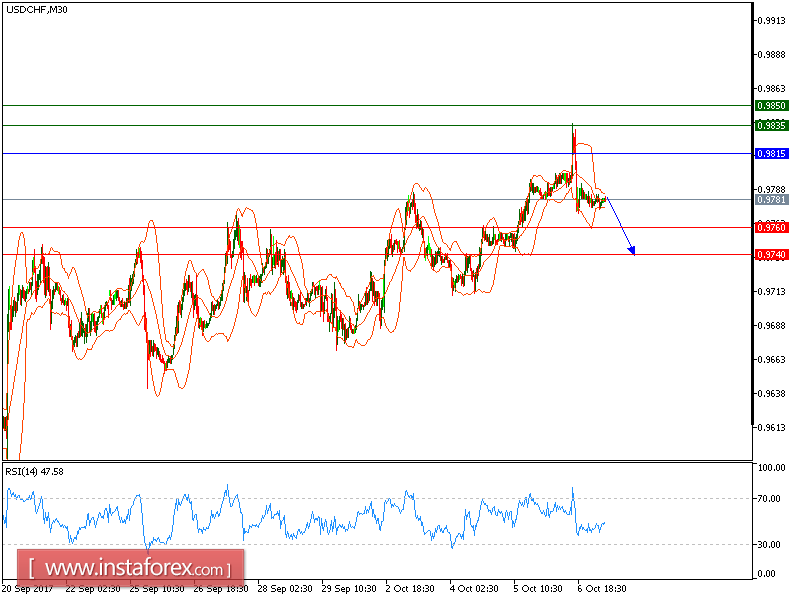
USD/CHF is expected to trade with a bearish outlook. The pair retreated from 0.9835 (the high of October 6) and broke below its 20-period and 50-period moving averages. In addition, the 20-period moving average crossed below the 50-period one. The relative strength index lacks downward momentum.
The U.S. Labor Department reported that the economy saw a loss of 33,000 nonfarm payrolls in September, compared with an addition of 80,000 expected and marking the first monthly decline since September 2010. Meanwhile, the jobless rate fell to a 16-year low of 4.2%, and the average hourly earnings increased 0.3% on month (as expected).
Therefore, as long as 0.9815 is resistance, a further decline to 0.9760 and even to 0.9740 seems more likely to occur.
Chart Explanation: The black line shows the pivot point. The present price above the pivot point indicates a bullish position, and the price below the pivot points indicates a short position. The red lines show the support levels and the green line indicates the resistance levels. These levels can be used to enter and exit trades.
Strategy: SELL, Stop Loss: 0.9815, Take Profit: 0.9760
Resistance levels: 0.9835, 0.9850, and 0.99900
Support levels: 0.9760, 0.9740, and 0.9700


