


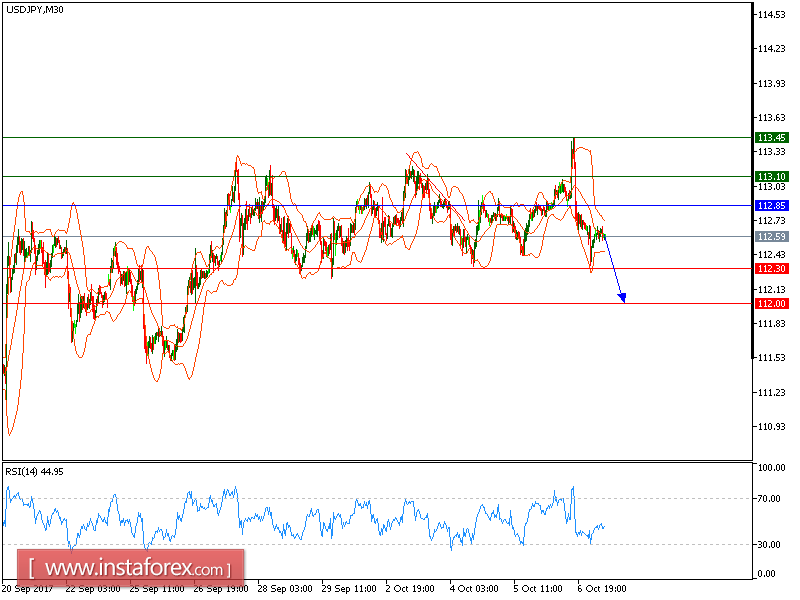
USD/JPY is expected to trade with bearish bias below 112.85. The pair posted a V-sharp bearish reversal from 113.45 (the high of Oct. 6). In addition, the 20-period moving average has crossed below a 50-period one. The relative strength index shows a downside momentum.
To conclude, as long as 112.85 holds on the upside, look for a further decline with targets at 112.30 and 112.00 in extension.
Alternatively, if the price moves in the opposite direction, a long position is recommended above 112.85 with a target at 113.10.
Chart Explanation: The black line shows the pivot point. The current price above the pivot point indicates a bullish position, while the price below the pivot point is a signal for a short position. The red lines show the support levels and the green line indicates the resistance level. These levels can be used to enter and exit trades.
Strategy: SELL, Stop Loss: 112.85, Take Profit: 112.30
Resistance levels: 113.10, 113.45 and 113.75 Support Levels: 112.30, 112.00, 111.75


