Main Quotes Calendar Forum
flag

FX.co ★ Ichimoku indicator analysis of gold for October 10, 2017

parent
Forex Analysis:::2017-10-10T07:10:09

Ichimoku indicator analysis of gold for October 10, 2017

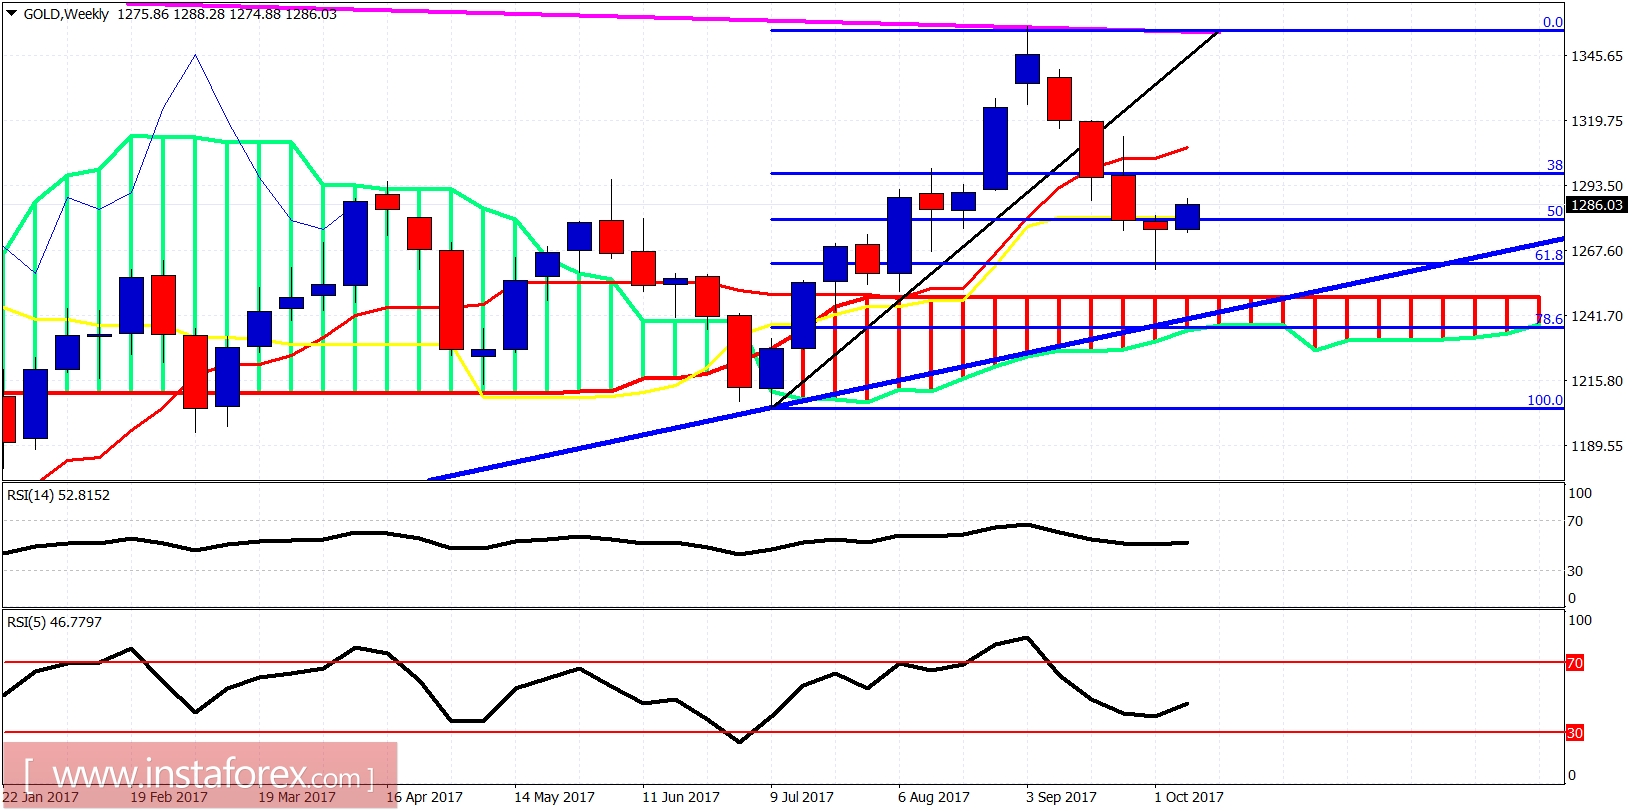
Gold price has broken above the short-term resistance trend lines and is testing important cloud resistance at $1,290. Breaking above the 4-hour cloud will be an important short-term reversal confirmation. I continue to believe that the next leg up towards $1,400 has started.

Ichimoku indicator analysis of gold for October 10, 2017

Black line -resistance

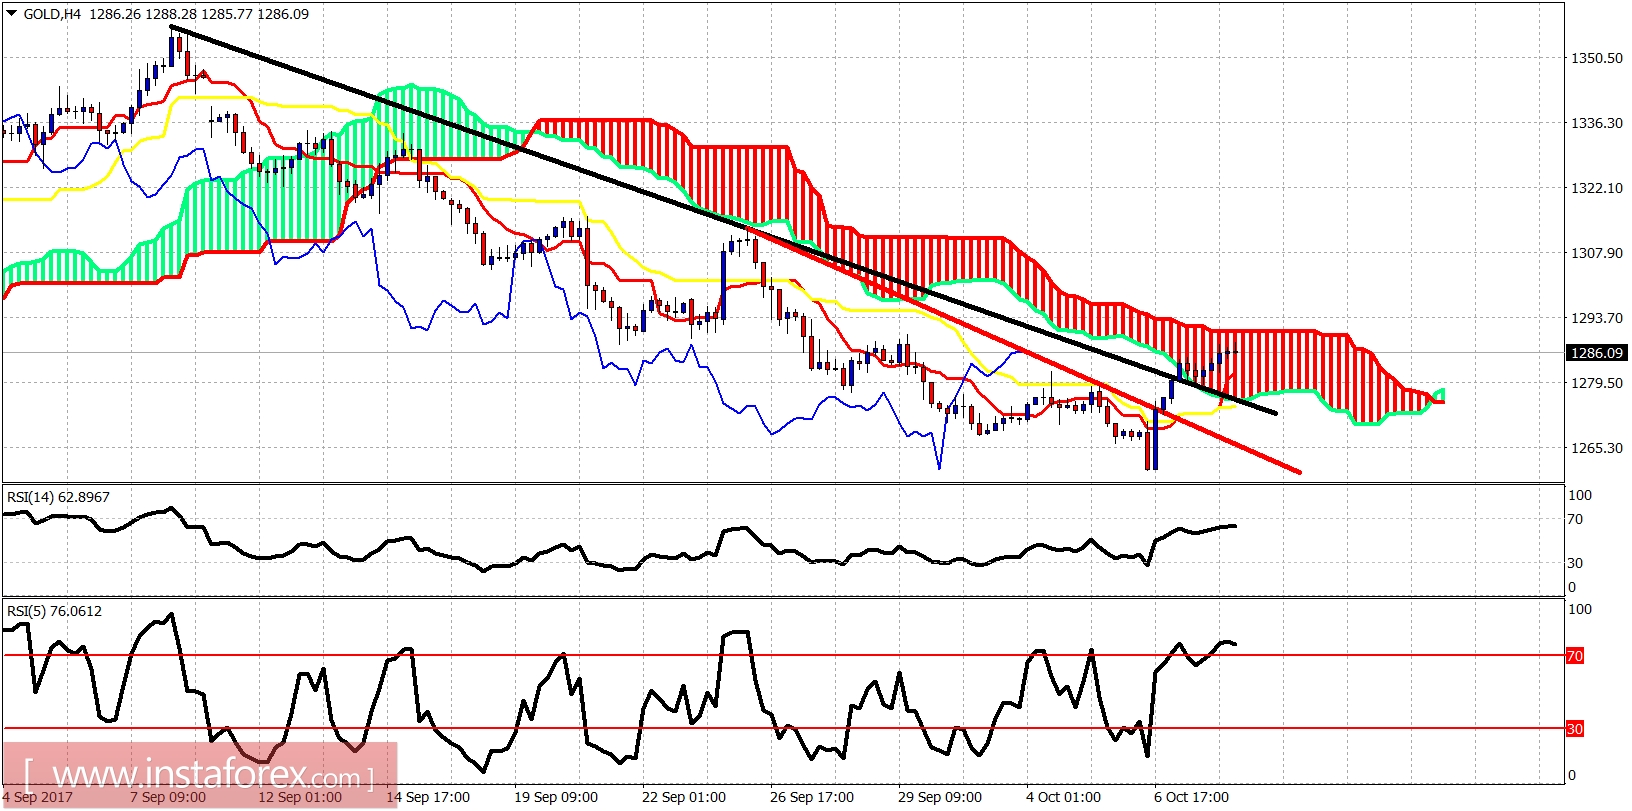
Red line - resistance

Gold price is trading above both the tenkan- and kijun-sen indicators and tries to break above the 4-hour Kumo (cloud) resistance. Support is at $1,280. Breaking above the Kumo will be a bullish sign.

Ichimoku indicator analysis of gold for October 10, 2017

On a weekly basis, Gold price has reacted positively right at the support by the 61.8% Fibonacci retracement. Last week's bullish hammer candlestick pattern is promising for the weeks to come. Last week's low is important support and bulls do not want it broken.
Analyst InstaForex
Share this article:
parent
loader...
all-was_read__icon
You have watched all the best publications
presently.
We are already looking for something interesting for you...
all-was_read__star
Recently published:
loader...
More recent publications...