


The Dollar index is making lower lows and is now testing important short-term cloud support. Short-term trend is still bullish but we have reversal signs since last Friday.
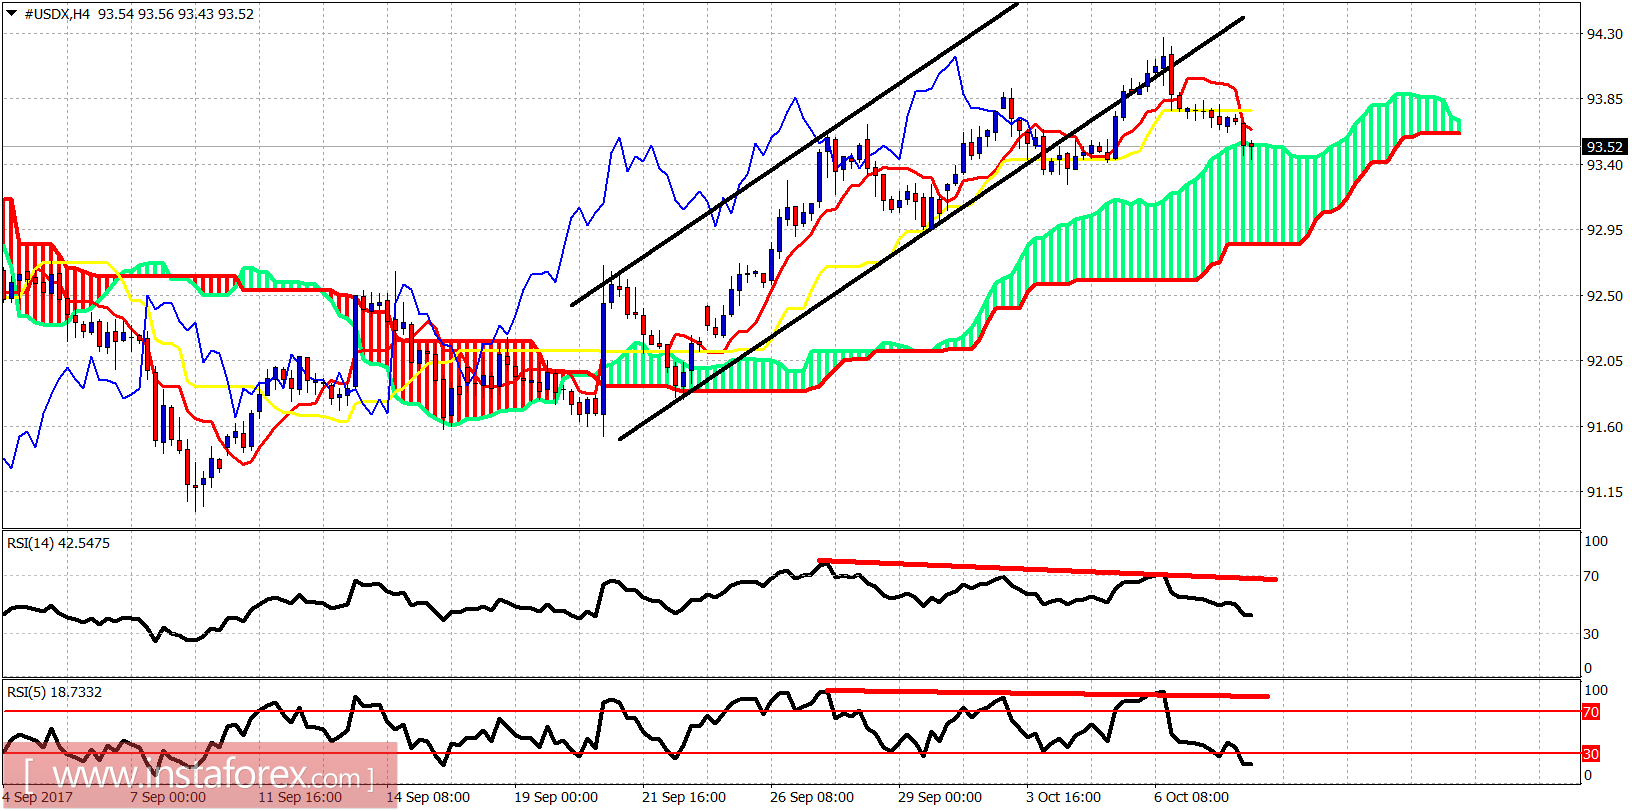
Red lines - bearish divergence signs
The Dollar index is at the upper cloud boundary in the 4 hour chart. Both RSI indicators have provided warning divergence signals to bulls since last week when price broke out of the bullish channel. The new high on Friday was followed by a reversal and this is not positive for Dollar bulls. Support is at 93.20-93 and if this area is broken, we should expect heavy selling to follow.
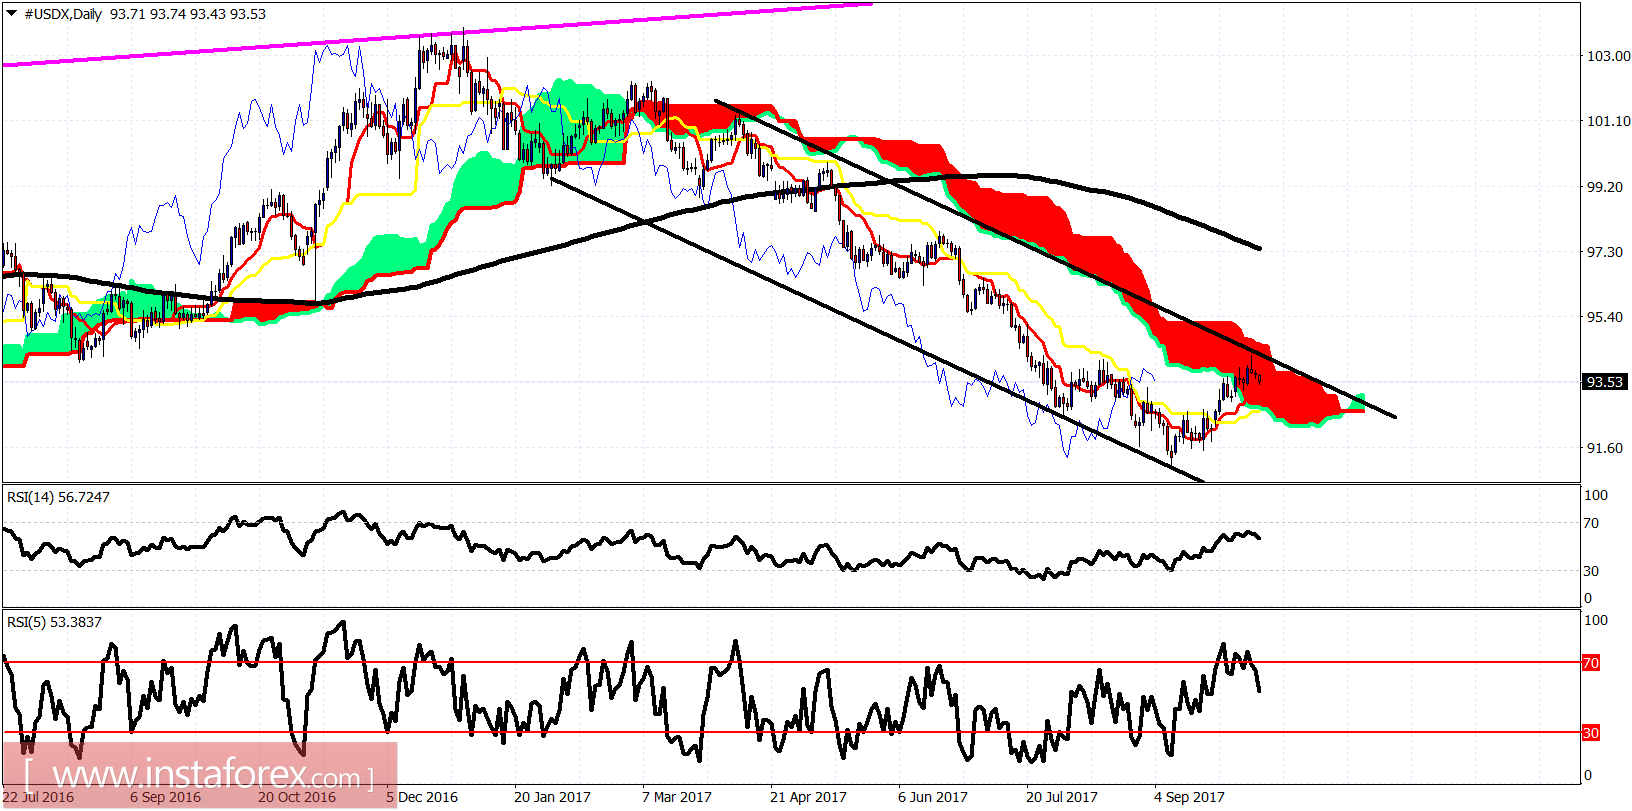
On a daily basis the Dollar index remains inside the bearish channel and inside the Kumo. A rejection here could at least push price towards the lower cloud boundary at 92.70. I'm bearish the Dollar index expecting new lows near 90.


