


USDX is retracing below the 200 SMA at H1 chart after a pullback seen in the resistance level of 94.04. The nearest support is placed at the 93.00 level, at which a rebound could happen to reach new highs. However, if the index does a break below such support, further declines are expected towards the 91.67 level.
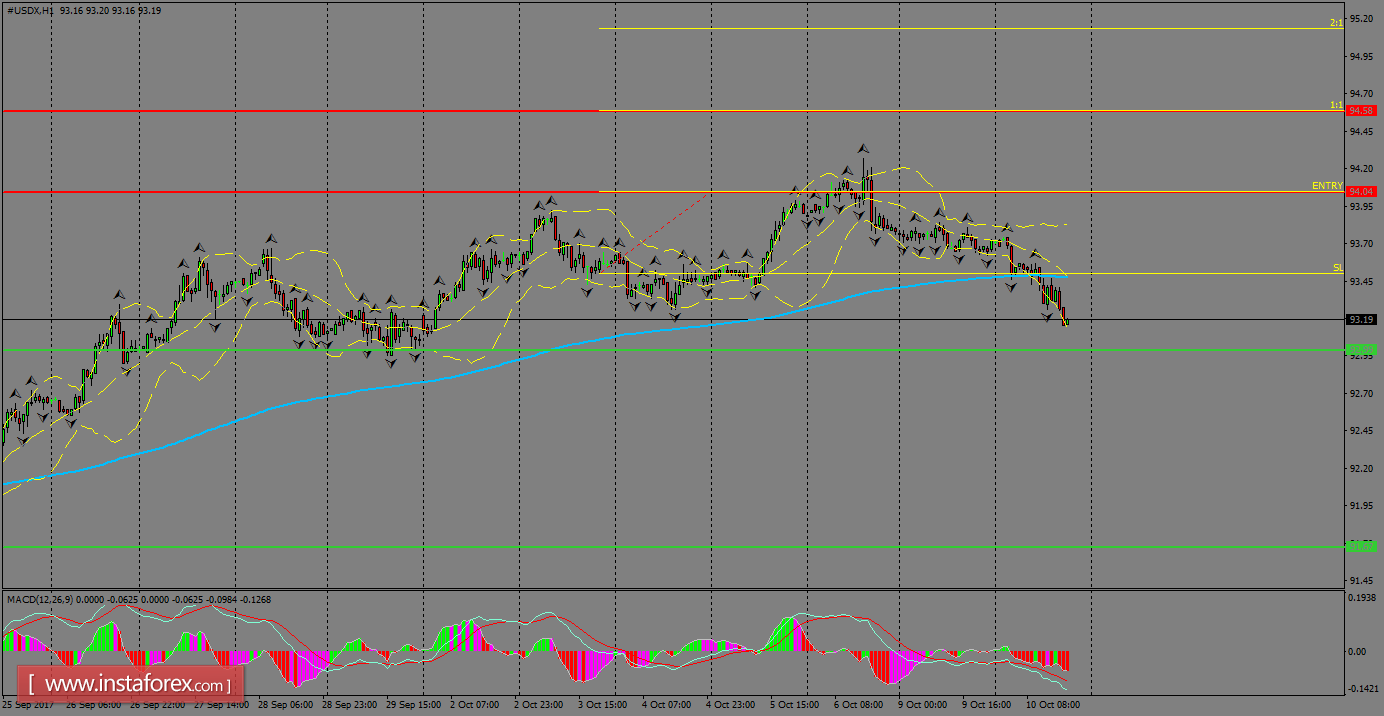
H1 chart's resistance levels: 94.04 / 94.58
H1 chart's support levels: 93.00 / 91.67
Trading recommendations for today: Based on the H1 chart, place buy (long) orders only if the USD Index breaks with a bullish candlestick; the resistance level is at 94.04, take profit is at 94.58 and stop loss is at 93.50.


