Gold price is near short-term support of $1,280-82. Gold price should bounce from current levels and break above $1,303 in order to move towards $1,400 to get started. Otherwise, we are in danger of moving lower towards $1,277 where the 61.8% Fibonacci retracement is found.
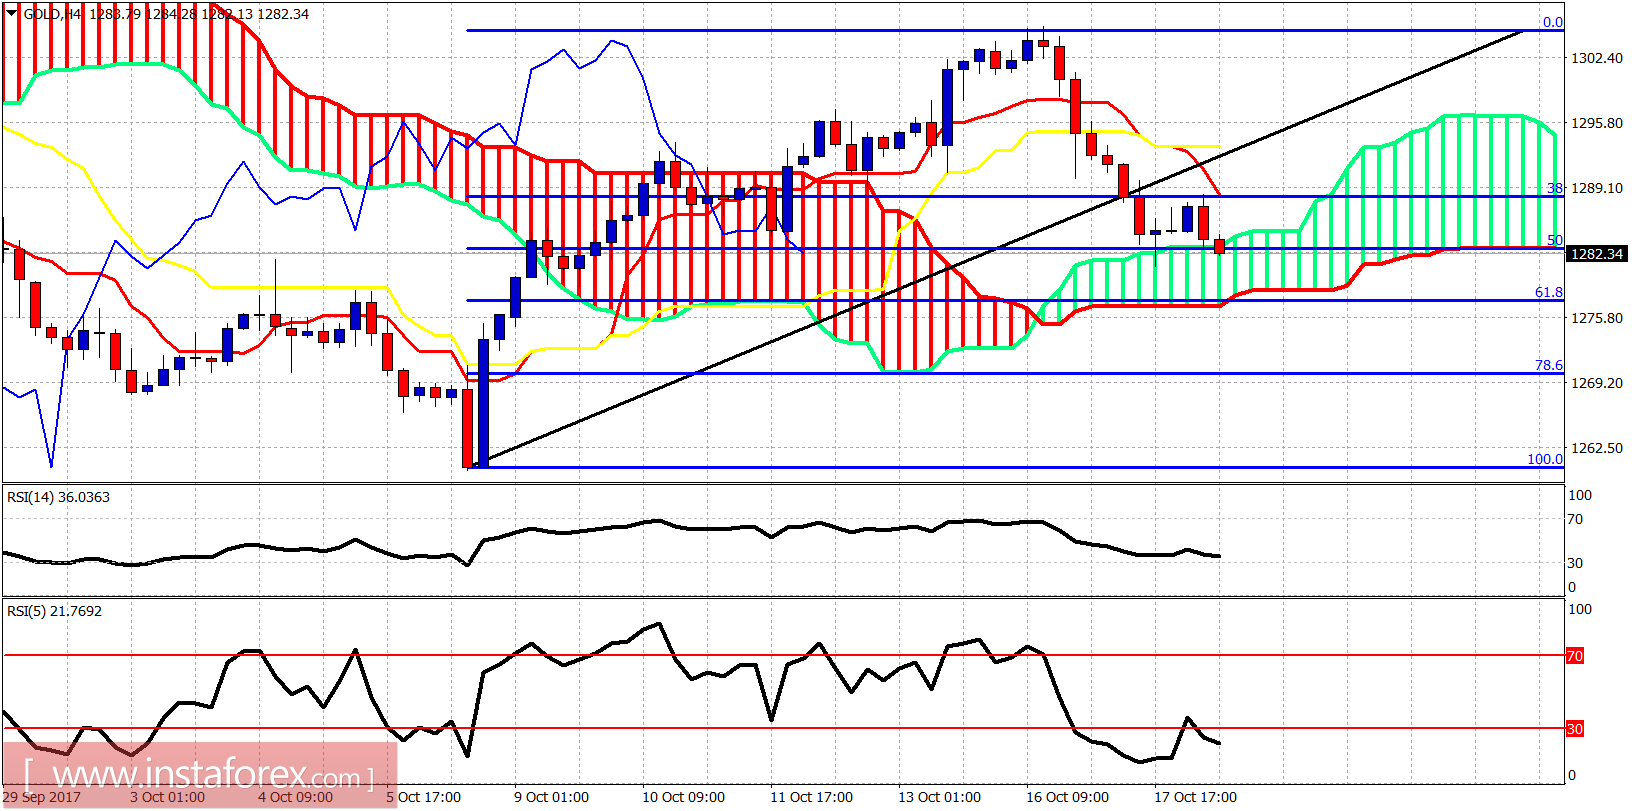
Gold price is at the upper Kumo (cloud) boundary and at the 50% Fibonacci retracement. Price could test today the lower cloud boundary and very important short-term support at the 61.8% Fibonacci retracement at $1,277. Resistance is at $1,289 and next at $1,293. For the bullish scenario to be valid, price must reverse soon to the upside.
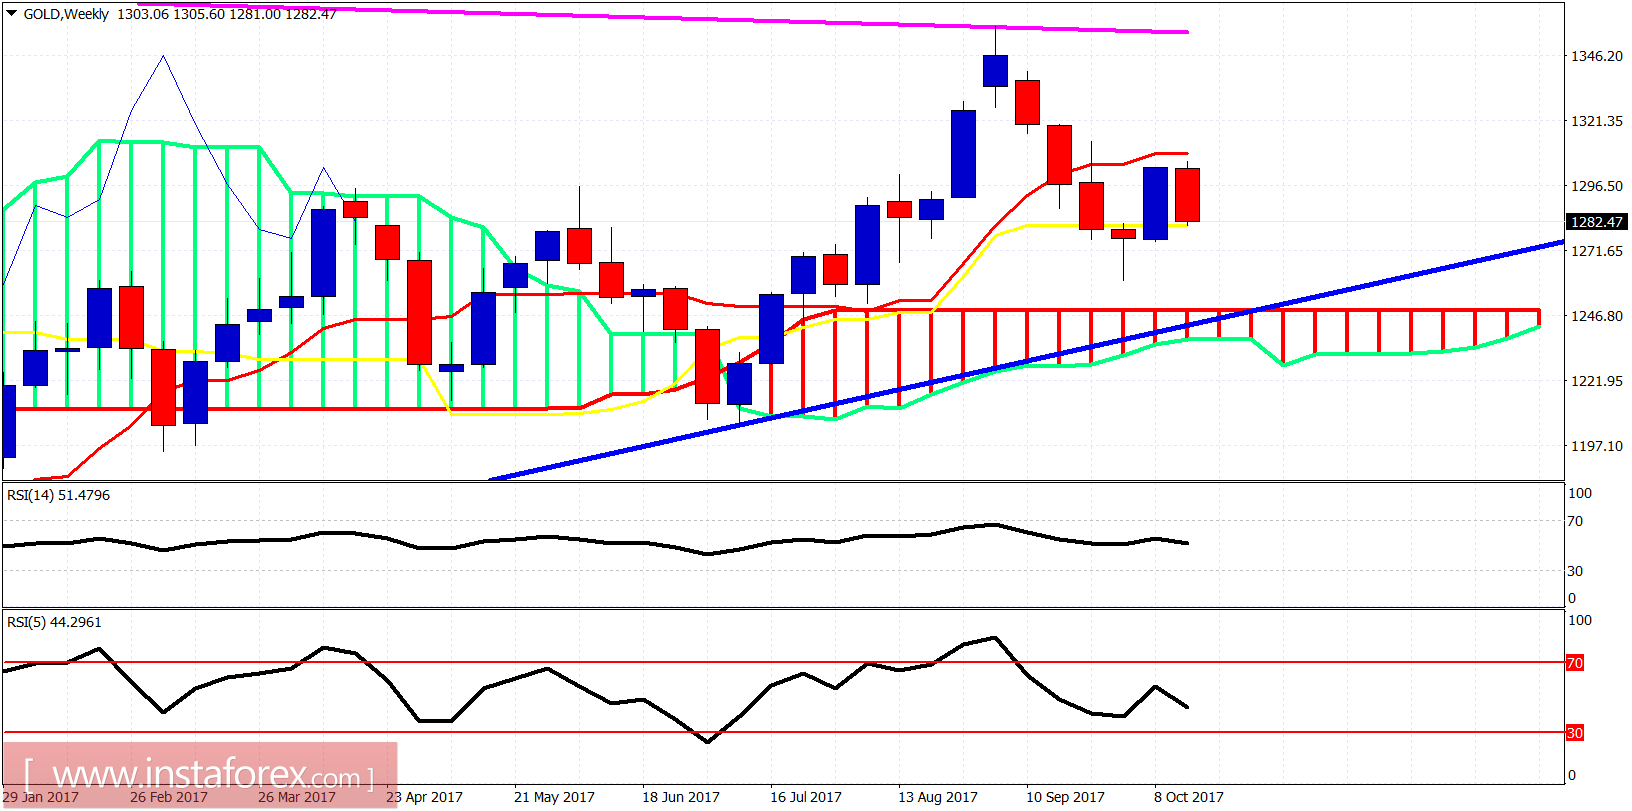
The weekly candle is testing the kijun-sen (yellow line indicator) support. Price should bounce strongly from current levels. Otherwise, the short-term bullish expectations will be vanished. If the kijun-sen is broken, we could see price test the weekly cloud at $1,245-40.


